Stock Analysis · APA Corporation (APA)
Overview
APA Corporation is an oil and gas exploration and production company. It searches for hydrocarbons, develops wells, and sells crude oil, natural gas, and natural gas liquids. The company’s main operating areas are in the United States, Egypt, and the North Sea, and it also has a large longer-term exploration position offshore Suriname through its TotalEnergies-led joint venture.
Its revenue is driven mostly by commodity sales rather than by downstream refining or chemicals. Based on the company’s recent annual reporting, the business mix is centered on produced volumes of oil, gas, and natural gas liquids, with crude oil usually representing the largest share of sales value because of pricing.
The main revenue sources can be summarized as follows:
- Crude oil sales: approximately 60% to 70% of total revenue. This is the largest contributor and includes production from U.S. onshore assets, Egypt, and the North Sea.
- Natural gas sales: approximately 20% to 30% of total revenue. This includes dry gas production, especially from U.S. assets.
- Natural gas liquids and other: approximately 5% to 15% of total revenue. This includes NGLs such as propane and butane, plus smaller ancillary items.
- By geography: the United States is typically the largest contributor, followed by Egypt, then the North Sea, while Suriname remains primarily a development and future-growth project rather than a meaningful current revenue source.
APA is best understood as a mid-sized upstream producer with a mix of mature cash-generating assets and one potentially transformational international development option. That combination gives the company both current earnings power and longer-duration upside, but it also makes results highly sensitive to oil and gas prices.
The business has shown how cyclical energy earnings can be. Revenue and operating income surged in the high-price environment of 2022, then normalized afterward. Even so, the cost base has remained relatively controlled, and profitability recovered meaningfully after the weaker 2024 period.
Key Figures
| Metric | Value | Sector ⓘ |
|---|---|---|
| Date | Oct 17, 2026 | |
| Context | ||
| Sector | Energy | |
| Industry | Oil & Gas E&P | |
| Market Cap ⓘ | $16.82B | |
| Beta ⓘ | 0.42 | |
Value (Cheapness) | ||
| P/E Ratio ⓘ | 10.15 | 15.44 |
| P/B Ratio ⓘ | 2.75 | 1.73 |
| FCF Yield ⓘ | 12.53% | 8.20% |
| Dividend Yield ⓘ | 2.13% | 3.59% |
| EBIT / EV ⓘ | 18.99% | 7.46% |
| PEG ⓘ | 1.18 | |
Growth (Business expansion) | ||
| Revenue Growth ⓘ | 9.20% | 26.90% |
| RPS Growth (5Y CAGR) ⓘ | 3.93% | 6.90% |
| EPS Growth (5Y CAGR) ⓘ | -20.54% | -15.73% |
| BVPS Growth (5Y CAGR) ⓘ | N/A | 6.07% |
| Margin Growth (5Y Trend) ⓘ | 3.74% | 0.58% |
| FCF Growth (5Y CAGR) ⓘ | -7.05% | 1.86% |
| DPS Growth (5Y CAGR) ⓘ | 39.96% | 16.79% |
Quality (Business durability) | ||
| ROIC (Latest) ⓘ | 21.30% | 11.40% |
| ROA (Latest) ⓘ | 9.40% | 6.06% |
| ROIC (5Y Median) ⓘ | 24.49% | 10.30% |
| ROA (5Y Median) ⓘ | 8.71% | 5.42% |
| Net Debt / EBIT (Latest) ⓘ | 0.97 | 1.64 |
| Net Debt / EBIT (5Y Median) ⓘ | 1.63 | 1.83 |
| Net Debt / EBITDA (Latest) ⓘ | 0.59 | 1.08 |
| Net Debt / Assets ⓘ | 19.12% | 17.29% |
| EBITDA / Interest ⓘ | 22.31 | 9.64 |
| Operating Margin (Latest) ⓘ | 40.32% | 16.27% |
| Operating Margin (5Y Median) ⓘ | 32.56% | 20.39% |
| Debt to Equity (Latest) ⓘ | 55.28% | 54.76% |
| Profit Margin (Latest) ⓘ | 19.56% | 8.82% |
| Free Cash Flow (Latest) ⓘ | $2.11B | |
Momentum (Price trend) | ||
| 3Y Return ⓘ | +28.73% | +67.38% |
| 12M Return (excl. last month) ⓘ | +104.03% | +49.19% |
| 6M Return ⓘ | +29.69% | +7.07% |
| Price vs. 200-Day MA ⓘ | +31.84% | +9.56% |
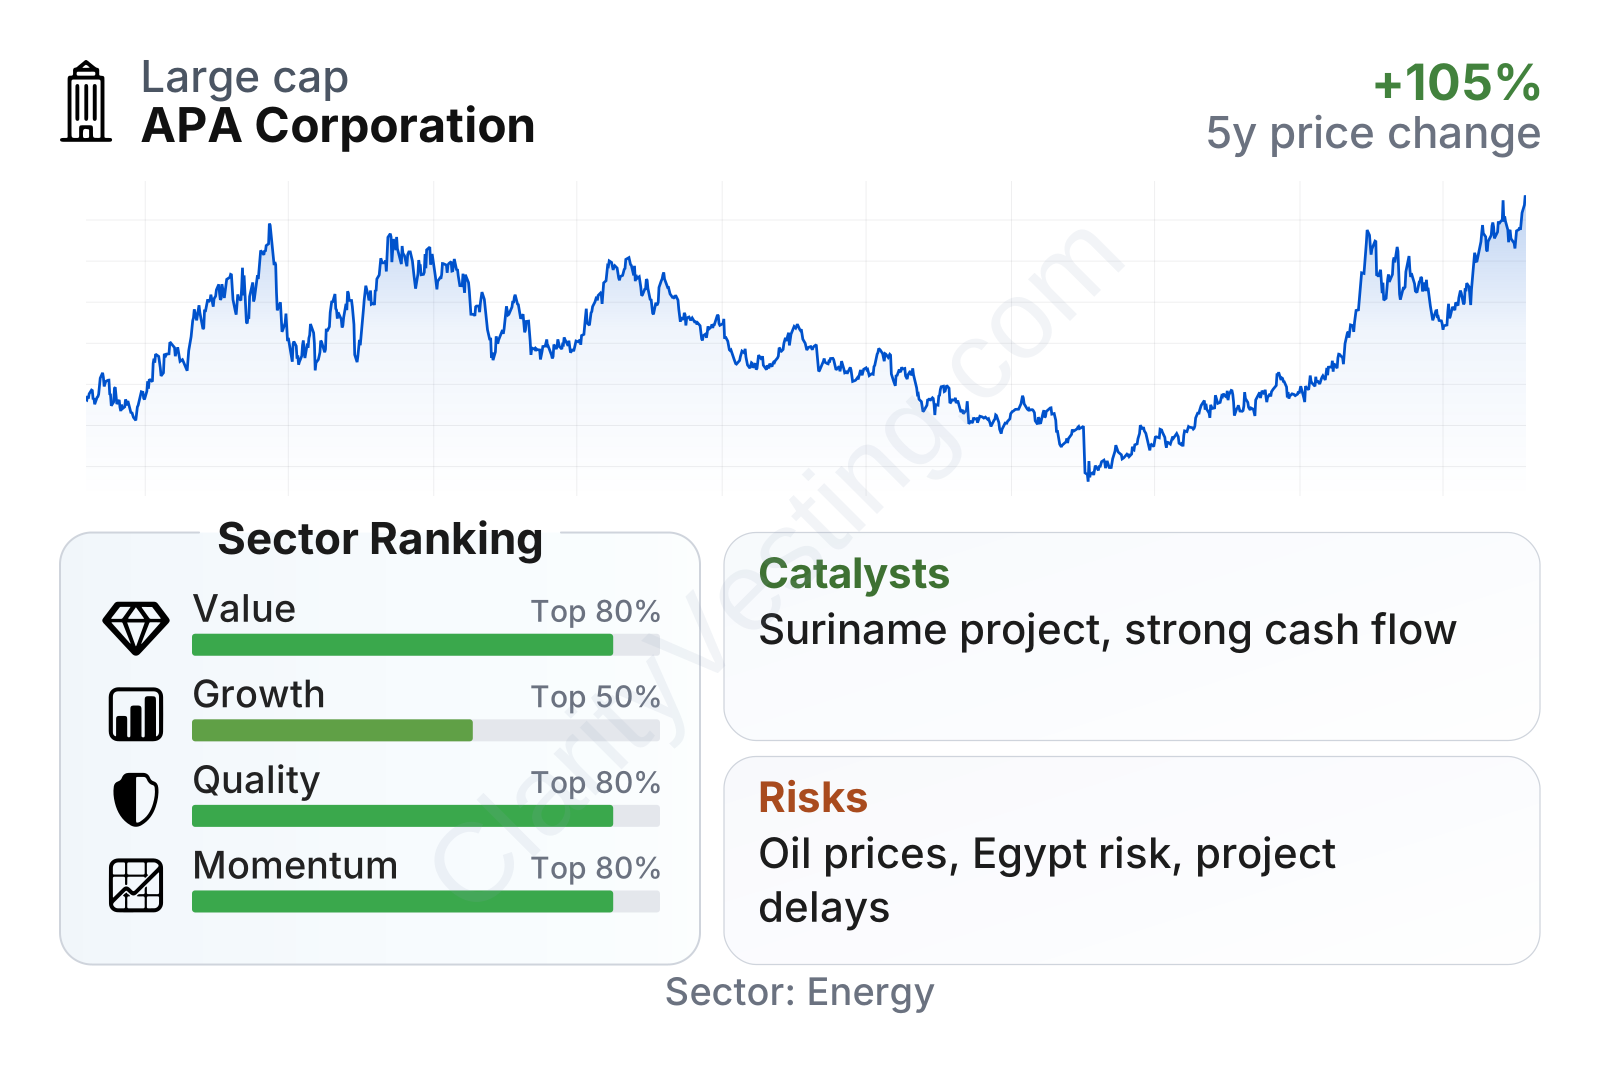
APA’s current profile is unusual in a useful way: valuation metrics look inexpensive relative to much of the sector, while quality metrics remain strong. Profitability, returns on capital, and interest coverage are all comfortably above typical industry levels. Growth metrics are more mixed, reflecting the ups and downs of commodity prices and the timing of development projects rather than a smooth expansion path.
The stock’s recent trading history also shows how volatile sentiment around the company can be. Shares fell sharply during the 2024-2025 weakness, then rebounded strongly in 2026. That pattern fits the economics of an upstream producer: market value can move faster than operating fundamentals when expectations around oil prices, project execution, or reserve value change.
Growth
APA operates in a sector that should remain economically important for many years, even as the global energy system gradually diversifies. Oil and gas demand growth is no longer viewed as a simple straight line, but the need for reliable supply, geopolitical diversification, and new project replacement still supports companies with good reserves and disciplined spending. In that context, APA’s strategy makes sense: use existing producing assets to generate cash, keep capital discipline, and advance a smaller number of high-impact projects.
A key part of the growth case is Suriname. APA, through its stake in the offshore development, has exposure to one of the more important emerging oil provinces discovered in recent years. If development continues as planned, Suriname could become the company’s most important production growth engine later in the decade. That matters because APA’s current base business is solid, but not naturally fast-growing on its own.
Revenue growth has been uneven. The company experienced very strong gains during the energy upswing, then contractions as prices and operating conditions normalized, followed by a return to modest positive growth more recently. That pattern suggests APA is not a steady compounding growth company in the usual sense; it is a cyclical producer whose expansion depends on both commodity prices and project timing.
Free cash flow remains one of the more encouraging points. Even after coming down from peak-cycle levels, APA is still producing substantial cash. That gives the company room to fund development, manage debt, and maintain shareholder returns without looking overly stretched. Another positive sign is that operating margin trends over the last five years have improved faster than the sector median, indicating that management has not relied only on higher oil prices to support results.
Recent company updates have also kept attention on portfolio shaping and development progress. For APA, the most significant opportunities are not likely to come from small quarterly beats, but from successful execution in Suriname, stable output from Egypt, and disciplined capital allocation across the broader portfolio.
Risks
This article is for informational purposes only and does not constitute financial advice. Some content is AI-generated. See Disclaimer


