Stock Analysis · Par Pacific Holdings Inc (PARR)
Overview
Par Pacific Holdings is an energy company focused on refining, logistics, and fuel marketing. Its business is built around turning crude oil and other feedstocks into transportation fuels and related products, then moving and selling those products in regional markets. The company has a distinctive geographic footprint, with operations centered on Hawaii, the Pacific Northwest, and Wyoming. That regional concentration matters because Par Pacific is not trying to compete as a giant global integrated oil major; it is operating a more targeted system where local supply positions, logistics assets, and branded retail relationships can be important.
The largest source of revenue is refining, which typically accounts for the clear majority of sales. Based on the company’s recent reporting structure and business mix, a reasonable approximation is:
- Refining – about 80% to 90%: sales of gasoline, diesel, jet fuel, marine fuels, asphalt, and other refined products from its refinery system.
- Retail and marketing – about 10% to 15%: fuel sales through branded and wholesale channels, including gas stations, convenience retail activity, and commercial fuel distribution.
- Logistics and other – about 3% to 8%: storage, terminals, pipelines, transportation, and support activities tied to moving petroleum products efficiently across its network.
What makes this model easier to understand is that most of Par Pacific’s economics still depend on refining margins: the spread between crude input costs and the prices it can realize on finished fuel products. Retail and logistics help support the system, but they do not remove the company’s exposure to cyclical energy markets.
Over the past several years, the business has shown how sensitive results are to refining conditions. Revenue stayed in the multi-billion-dollar range, while profitability swung from losses to very strong earnings and then back to pressure before recovering again. That pattern is typical for refiners, but Par Pacific’s regional assets can create periods of outsized upside when local market conditions are favorable.
The long-term picture shows a business with volatile top-line movement but a meaningful improvement in operating earnings compared with 2021. After a weak 2024, profitability recovered sharply in 2025, which helps explain why the market has re-rated the company more positively.
Key Figures
| Metric | Value | Sector ⓘ |
|---|---|---|
| Date | Oct 24, 2026 | |
| Context | ||
| Sector | Energy | |
| Industry | Oil & Gas Refining & Marketing | |
| Market Cap ⓘ | $4.26B | |
| Beta ⓘ | 0.75 | |
Value (Cheapness) | ||
| P/E Ratio ⓘ | 4.97 | 15.40 |
| P/B Ratio ⓘ | 2.84 | 1.71 |
| FCF Yield ⓘ | 10.30% | 8.24% |
| Dividend Yield ⓘ | N/A | 3.52% |
| EBIT / EV ⓘ | 24.61% | 7.45% |
| PEG ⓘ | N/A | |
Growth (Business expansion) | ||
| Revenue Growth ⓘ | 56.80% | 26.85% |
| RPS Growth (5Y CAGR) ⓘ | 16.06% | 6.78% |
| EPS Growth (5Y CAGR) ⓘ | 9.06% | -14.41% |
| BVPS Growth (5Y CAGR) ⓘ | 58.66% | 6.08% |
| Margin Growth (5Y Trend) ⓘ | 7.80% | 0.55% |
| FCF Growth (5Y CAGR) ⓘ | N/A | 2.75% |
| DPS Growth (5Y CAGR) ⓘ | N/A | 16.79% |
Quality (Business durability) | ||
| ROIC (Latest) ⓘ | 36.77% | 11.30% |
| ROA (Latest) ⓘ | 21.67% | 6.00% |
| ROIC (5Y Median) ⓘ | 18.64% | 10.35% |
| ROA (5Y Median) ⓘ | 9.35% | 5.46% |
| Net Debt / EBIT (Latest) ⓘ | 0.89 | 1.64 |
| Net Debt / EBIT (5Y Median) ⓘ | 1.49 | 1.82 |
| Net Debt / EBITDA (Latest) ⓘ | 0.79 | 1.08 |
| Net Debt / Assets ⓘ | 27.41% | 17.29% |
| EBITDA / Interest ⓘ | 19.32 | 9.53 |
| Operating Margin (Latest) ⓘ | 13.71% | 16.21% |
| Operating Margin (5Y Median) ⓘ | 5.92% | 20.55% |
| Debt to Equity (Latest) ⓘ | 80.37% | 52.27% |
| Profit Margin (Latest) ⓘ | 9.94% | 8.79% |
| Free Cash Flow (Latest) ⓘ | $439.12M | |
Momentum (Price trend) | ||
| 3Y Return ⓘ | +160.22% | +68.93% |
| 12M Return (excl. last month) ⓘ | +134.49% | +42.90% |
| 6M Return ⓘ | +37.59% | +9.18% |
| Price vs. 200-Day MA ⓘ | +34.88% | +9.87% |
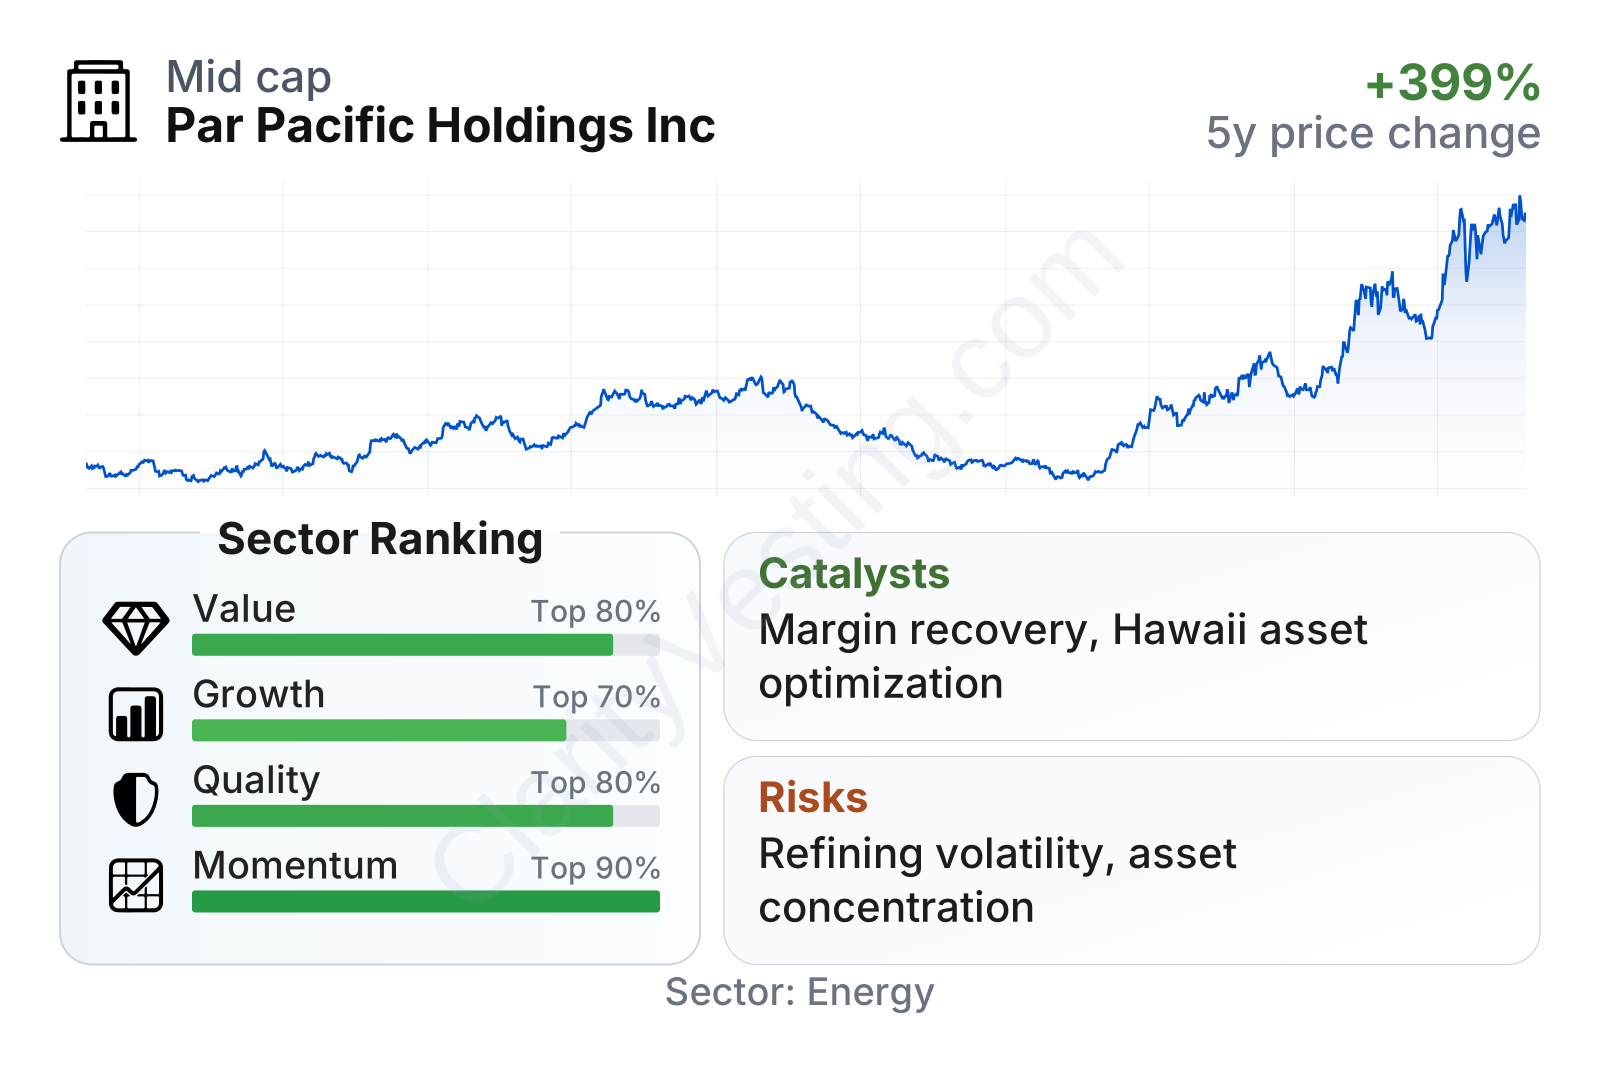
Par Pacific currently screens well on value, quality, and momentum relative to much of the energy sector. The earnings multiple is very low versus the sector median, free cash flow yield is solid, and returns on capital are unusually strong. Growth metrics are also above sector norms, although that comes with the usual caution that refining results can change quickly from one cycle to the next. The company is mid-sized rather than a giant operator, and its share price has been much stronger than the typical energy stock over the last year and over three years.
One point worth noting is the mixed balance between valuation and capital structure. Operating performance and cash generation look strong right now, but book-value valuation and leverage do not look as conservative as the low earnings multiple alone might suggest.
Growth
Par Pacific operates in a mature industry rather than a classic high-growth sector. Fuel demand in developed markets does not usually expand at technology-like rates, and long-term energy transition trends create some structural uncertainty for refiners. Even so, refining remains essential to transportation, aviation, marine activity, and industrial demand. In that setting, growth for Par Pacific is less about a rapidly expanding end market and more about improving asset performance, capturing regional supply advantages, and making disciplined acquisitions or upgrades.
The company’s strategy is coherent for that kind of industry. It has built a network of refineries, terminals, pipelines, and marketing outlets in regions where logistics barriers can matter. Hawaii is especially notable because local infrastructure and product supply dynamics can support attractive economics when the system runs well. The same applies, in a different way, to the Pacific Northwest and Rockies, where regional balancing of crude access, refining capacity, and product demand can create favorable periods for local operators.
Revenue growth has been uneven, which is normal in refining because sales are influenced by both fuel prices and volumes. After several quarters of contraction, the latest year-over-year rebound is very strong, suggesting the company has moved into a much better operating environment. That does not mean growth will be linear, but it does show how quickly earnings power can recover when margins improve.
Cash generation has also been volatile, moving from negative territory to very strong levels, then softening and recovering again. This is one of the clearest signs that Par Pacific is a cyclical operator rather than a steady compounder. Still, the return to positive trailing free cash flow is important because it supports balance sheet flexibility, maintenance spending, and potential capital allocation options.
A meaningful catalyst in recent periods has been the company’s ability to recover from weaker 2024 conditions and restore profitability. In a refining business, that usually reflects some mix of better utilization, improved regional margins, and stronger commercial execution. Public company updates have also highlighted ongoing work around asset optimization and integration across the network, which can matter more for a regional refiner than sheer scale alone.
Risks
This article is for informational purposes only and does not constitute financial advice. Some content is AI-generated. See Disclaimer


