Stock Analysis · Riley Exploration Permian Inc (REPX)
Overview
Riley Exploration Permian is a small independent oil and gas producer focused mainly on the Permian Basin, one of the most important hydrocarbon regions in the United States. The company explores for, develops, and produces crude oil, natural gas, and natural gas liquids from its acreage, with a particular concentration in the Yeso Trend area of the Northwest Shelf in New Mexico. In simple terms, it earns money by bringing hydrocarbons out of the ground and selling them into the market.
Its revenue is tied primarily to commodity production, with oil usually carrying the highest value per barrel equivalent and therefore the biggest influence on profits. Based on the company’s recent annual reporting structure, revenue can be understood through the following main streams:
- Crude oil sales: approximately 60% to 75% of total revenue in recent periods. This is the largest driver because oil prices are generally higher than gas prices on an energy-equivalent basis.
- Natural gas liquids sales: approximately 15% to 25%. This includes products such as propane, butane, and related liquids separated during production.
- Natural gas sales: approximately 10% to 20%. This is the smallest of the three major production categories by revenue, even when gas volumes can be meaningful.
The business model is fairly straightforward: acquire and develop acreage, drill wells, manage production costs, and use the resulting cash flow to fund more development, service debt, and return some capital to shareholders through dividends. The company is not a diversified energy conglomerate; it is a focused upstream producer, which means results can move sharply with production growth, well performance, and oil and gas prices.
Over the last several years, the company’s financial structure has improved from a loss-making profile into one with materially higher revenue and solid profitability, although the path has not been perfectly smooth. Revenue rose from roughly $151 million in 2021 to about $392 million in 2025, while profitability and operating income also moved significantly higher over that period. The biggest takeaway is that REPX has become a more meaningful cash-generating producer, but it remains closely tied to the cycle of the oil and gas market.
The company’s financial flow shows a major turnaround since 2021: revenue and operating income have expanded sharply, and net income has shifted from a loss to solid profitability. The main point to watch is that interest expense has also become more noticeable, so future value creation depends not only on production growth but also on maintaining cost discipline and balance sheet control.
Key Figures
| Metric | Value | Sector ⓘ |
|---|---|---|
| Date | Oct 17, 2026 | |
| Context | ||
| Sector | Energy | |
| Industry | Oil & Gas E&P | |
| Market Cap ⓘ | $1.01B | |
| Beta ⓘ | 1.04 | |
Value (Cheapness) | ||
| P/E Ratio ⓘ | 8.50 | 15.44 |
| P/B Ratio ⓘ | 1.56 | 1.73 |
| FCF Yield ⓘ | 5.91% | 8.20% |
| Dividend Yield ⓘ | 3.35% | 3.59% |
| EBIT / EV ⓘ | 10.15% | 7.46% |
| PEG ⓘ | 2.84 | |
Growth (Business expansion) | ||
| Revenue Growth ⓘ | 94.20% | 26.90% |
| RPS Growth (5Y CAGR) ⓘ | 18.35% | 6.90% |
| EPS Growth (5Y CAGR) ⓘ | -13.95% | -15.73% |
| BVPS Growth (5Y CAGR) ⓘ | 19.16% | 6.07% |
| Margin Growth (5Y Trend) ⓘ | 81.46% | 0.58% |
| FCF Growth (5Y CAGR) ⓘ | 35.49% | 1.86% |
| DPS Growth (5Y CAGR) ⓘ | 6.24% | 16.79% |
Quality (Business durability) | ||
| ROIC (Latest) ⓘ | 10.11% | 11.40% |
| ROA (Latest) ⓘ | 9.64% | 6.06% |
| ROIC (5Y Median) ⓘ | 22.32% | 10.30% |
| ROA (5Y Median) ⓘ | 14.87% | 5.42% |
| Net Debt / EBIT (Latest) ⓘ | 2.12 | 1.64 |
| Net Debt / EBIT (5Y Median) ⓘ | 1.38 | 1.83 |
| Net Debt / EBITDA (Latest) ⓘ | 1.11 | 1.08 |
| Net Debt / Assets ⓘ | 19.43% | 17.29% |
| EBITDA / Interest ⓘ | 7.04 | 9.64 |
| Operating Margin (Latest) ⓘ | 24.11% | 16.27% |
| Operating Margin (5Y Median) ⓘ | 46.66% | 20.39% |
| Debt to Equity (Latest) ⓘ | 42.23% | 54.76% |
| Profit Margin (Latest) ⓘ | 24.53% | 8.82% |
| Free Cash Flow (Latest) ⓘ | $59.50M | |
Momentum (Price trend) | ||
| 3Y Return ⓘ | +72.01% | +67.38% |
| 12M Return (excl. last month) ⓘ | +65.23% | +49.19% |
| 6M Return ⓘ | +36.35% | +7.07% |
| Price vs. 200-Day MA ⓘ | +35.55% | +9.56% |
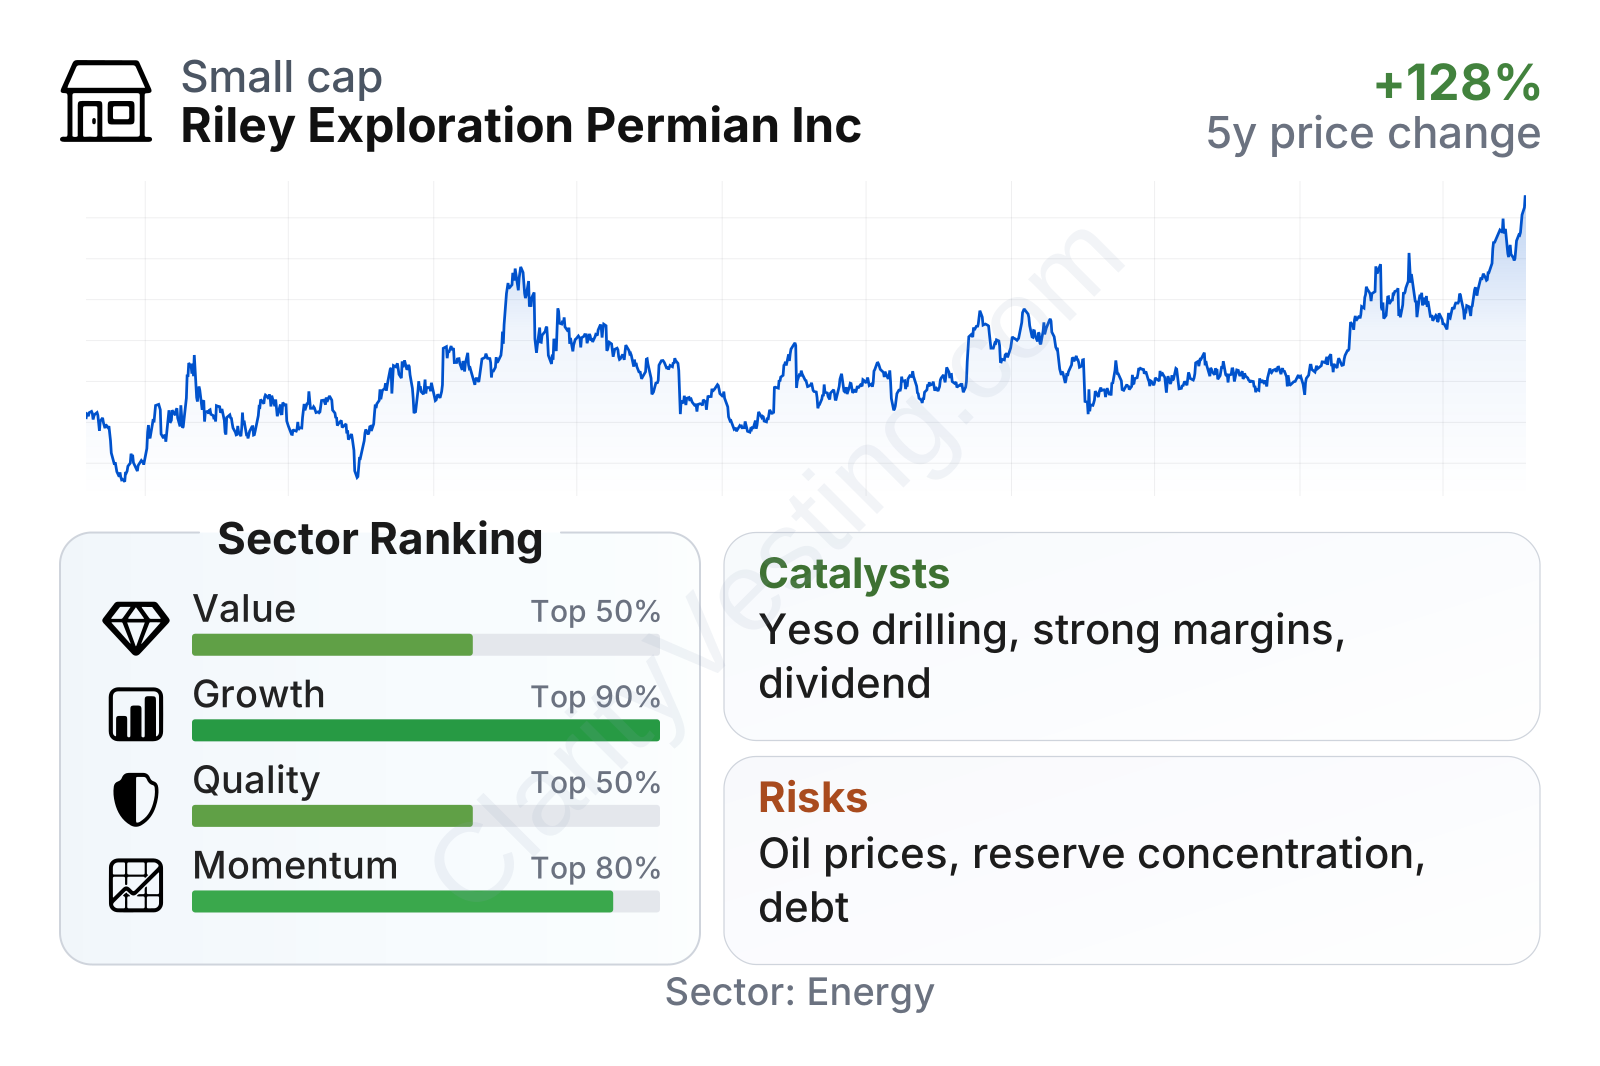
Riley Exploration Permian stands out most on growth and profitability. Revenue growth, cash generation over time, and margin strength all compare well with much of the energy sector. Valuation also looks undemanding on earnings and operating value measures, although free cash flow yield is not as strong as the cheapest names in the group. Financial quality is decent rather than exceptional, with leverage and interest coverage still worth monitoring.
The share price history shows a stock that has been volatile but generally upward-trending over the past several years. That fits the profile of a smaller exploration and production company: strong upside during favorable operating and commodity periods, with meaningful drawdowns when markets or expectations cool.
Growth
The company operates in a sector that is mature rather than structurally high-growth, but selected operators can still grow very effectively by drilling better wells, improving recovery rates, and allocating capital carefully. That is especially true in the Permian Basin, where geology, infrastructure, and industry know-how remain attractive relative to many other North American oil and gas regions. REPX’s strategy makes sense in that context: it is concentrated in a known basin, it focuses on operated development, and it has shown an ability to turn that focus into stronger production and revenue over time.
Recent revenue growth has been uneven, which is normal in upstream energy because volumes, timing, acquisitions, and realized prices can all distort quarter-to-quarter comparisons. Even so, the latest year-over-year growth rate is exceptionally strong and far above the sector median. That suggests either a step-up in production, stronger pricing, or both. Over a five-year view, revenue per share has compounded at a rate well ahead of the typical peer, which indicates the company has expanded in a way that has translated into more business per share, not just a larger absolute footprint.
Free cash flow remains one of the most important indicators for a producer like REPX because accounting earnings can look strong even when drilling and development consume large amounts of cash. The longer-term trend is encouraging: free cash flow improved sharply through 2025 before moderating in the most recent trailing period. That pullback does not erase the progress, but it does show how quickly cash generation can change when capital spending rises or commodity prices move against the company.
A practical growth catalyst is the company’s ability to continue developing its inventory in the Yeso area while keeping well returns attractive. Another important support is operating efficiency: the company’s five-year median returns on capital and assets have been stronger than many peers, which suggests past development has not simply been growth for growth’s sake. If management can continue converting acreage into profitable barrels while controlling debt and preserving margins, the growth case remains credible.
Recent company reporting and investor materials have also highlighted continued development activity, reserve progression, and ongoing shareholder returns through dividends. For a company of this size, that combination matters: internally funded drilling plus cash returns can support long-term equity value if commodity conditions remain constructive.
Risks
This article is for informational purposes only and does not constitute financial advice. Some content is AI-generated. See Disclaimer


