Stock Analysis · Range Resources Corp (RRC)
Overview
Range Resources is a U.S. natural gas producer focused on the Appalachian Basin, especially the Marcellus Shale in Pennsylvania. In simple terms, the company drills wells, produces natural gas and related hydrocarbons, and sells those volumes into domestic and export-linked energy markets. Its business is not diversified across many industries: it is mainly a commodity producer whose results depend on production levels, operating efficiency, and market prices for gas, natural gas liquids, and oil.
The company’s revenue comes mostly from selling production from its upstream operations. Based on recent company reporting, the mix is heavily tilted toward natural gas, with additional contributions from natural gas liquids and a smaller amount from oil and condensate.
- Natural gas: approximately 68% to 72% of revenue. This is the company’s core product and includes gas sold from Appalachian production.
- Natural gas liquids (NGLs): approximately 22% to 27% of revenue. This category generally includes ethane, propane, butane, and other liquids separated from the gas stream.
- Oil, condensate, and other: approximately 4% to 8% of revenue. This is the smallest part of the mix and is not the main economic driver.
That revenue structure matters because it makes Range Resources much more sensitive to natural gas pricing than many larger energy companies that also own refining, chemicals, or international oil assets. The trade-off is that if gas markets strengthen, the company is directly exposed to that upside.
Over the last several years, revenue and earnings have moved sharply with commodity prices, but the company has also improved its cost structure and reduced interest expense through debt reduction. That has made the business financially cleaner than it used to be, even though it remains cyclical by nature.
The overall financial flow shows a business that can swing widely with energy prices, but it also shows meaningful progress in discipline. Revenue fell sharply after the 2022 peak, then recovered in 2025, while interest expense trended lower over time. That decline in financing costs is one of the clearest signs that balance-sheet repair has strengthened the company’s resilience.
Key Figures
| Metric | Value | Sector ⓘ |
|---|---|---|
| Date | Oct 17, 2026 | |
| Context | ||
| Sector | Energy | |
| Industry | Oil & Gas E&P | |
| Market Cap ⓘ | $9.93B | |
| Beta ⓘ | 0.71 | |
Value (Cheapness) | ||
| P/E Ratio ⓘ | 11.73 | 15.44 |
| P/B Ratio ⓘ | 2.10 | 1.73 |
| FCF Yield ⓘ | 11.83% | 8.20% |
| Dividend Yield ⓘ | 0.92% | 3.59% |
| EBIT / EV ⓘ | 11.08% | 7.46% |
| PEG ⓘ | 0.96 | |
Growth (Business expansion) | ||
| Revenue Growth ⓘ | 8.60% | 26.90% |
| RPS Growth (5Y CAGR) ⓘ | -3.44% | 6.90% |
| EPS Growth (5Y CAGR) ⓘ | -19.60% | -15.73% |
| BVPS Growth (5Y CAGR) ⓘ | 21.13% | 6.07% |
| Margin Growth (5Y Trend) ⓘ | 13.71% | 0.58% |
| FCF Growth (5Y CAGR) ⓘ | 11.95% | 1.86% |
| DPS Growth (5Y CAGR) ⓘ | 125.91% | 16.79% |
Quality (Business durability) | ||
| ROIC (Latest) ⓘ | 15.89% | 11.40% |
| ROA (Latest) ⓘ | 11.66% | 6.06% |
| ROIC (5Y Median) ⓘ | 13.29% | 10.30% |
| ROA (5Y Median) ⓘ | 8.91% | 5.42% |
| Net Debt / EBIT (Latest) ⓘ | 0.91 | 1.64 |
| Net Debt / EBIT (5Y Median) ⓘ | 1.47 | 1.83 |
| Net Debt / EBITDA (Latest) ⓘ | 0.68 | 1.08 |
| Net Debt / Assets ⓘ | 13.44% | 17.29% |
| EBITDA / Interest ⓘ | 18.11 | 9.64 |
| Operating Margin (Latest) ⓘ | 33.73% | 16.27% |
| Operating Margin (5Y Median) ⓘ | 29.62% | 20.39% |
| Debt to Equity (Latest) ⓘ | 21.59% | 54.76% |
| Profit Margin (Latest) ⓘ | 26.31% | 8.82% |
| Free Cash Flow (Latest) ⓘ | $1.17B | |
Momentum (Price trend) | ||
| 3Y Return ⓘ | +23.15% | +67.38% |
| 12M Return (excl. last month) ⓘ | +16.95% | +49.19% |
| 6M Return ⓘ | +3.34% | +7.07% |
| Price vs. 200-Day MA ⓘ | +6.13% | +9.56% |
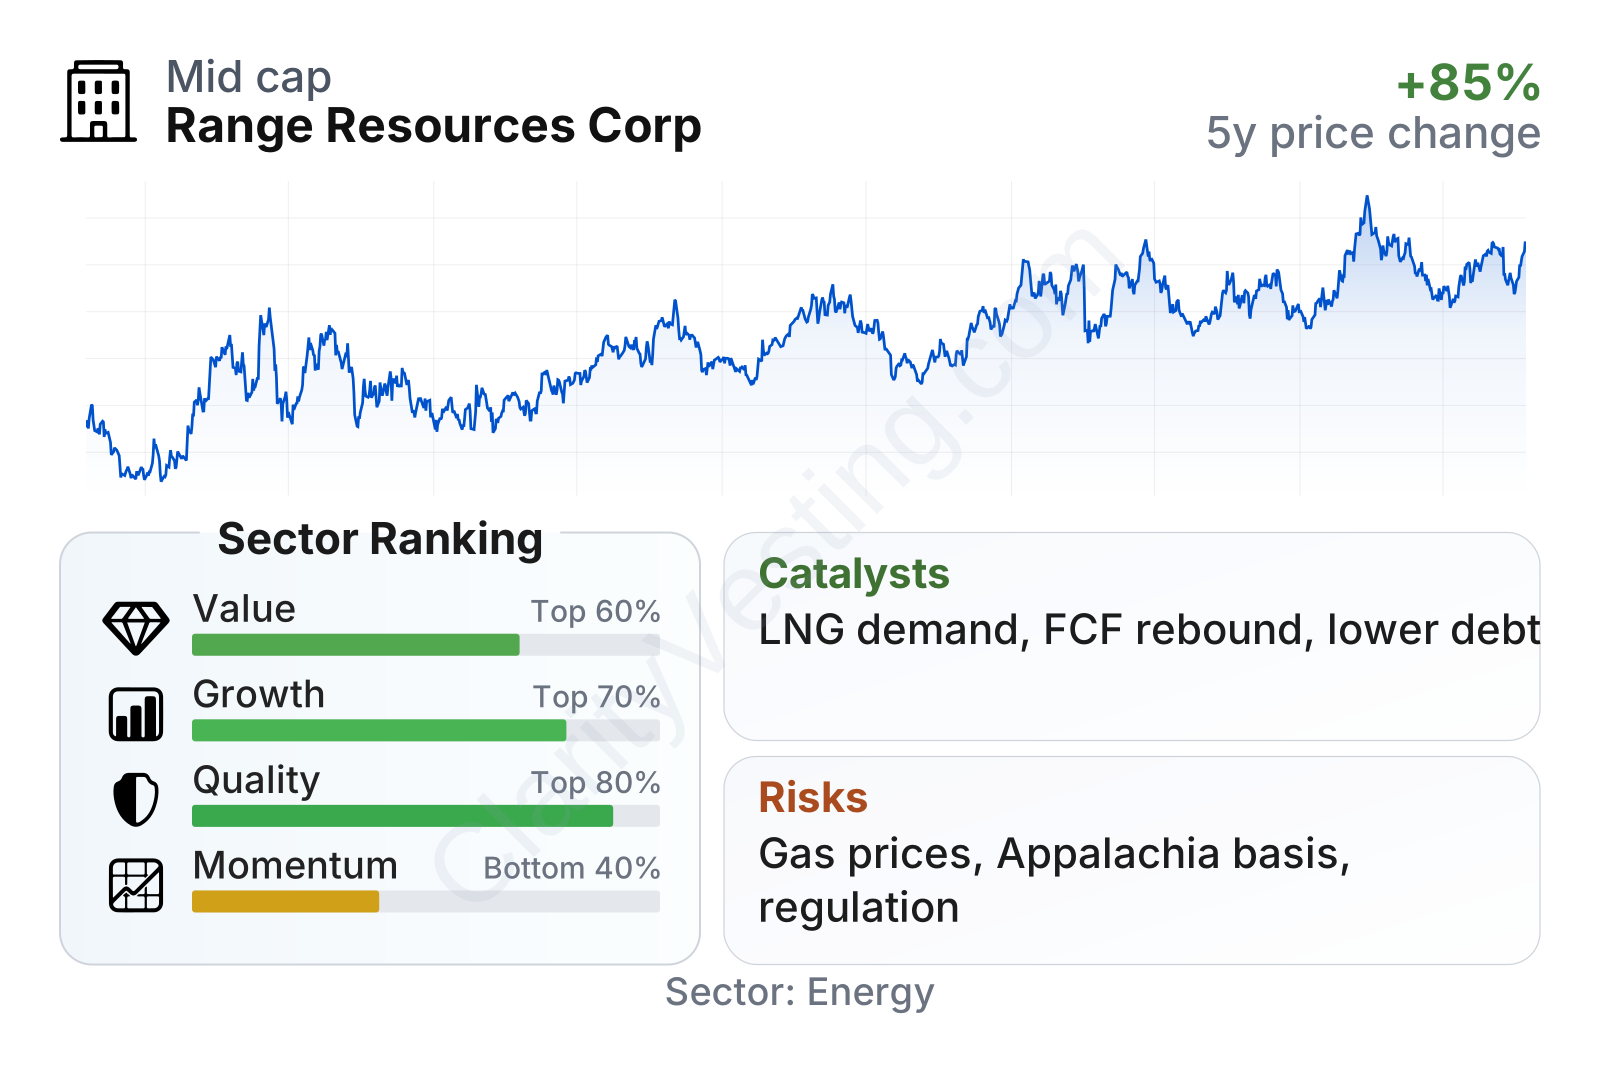
Range Resources is a mid-sized energy producer with a market value around the high single-digit billions of dollars. The stock’s beta is relatively low for an exploration and production company, which suggests less share-price volatility than many peers, although commodity exposure still makes the business inherently cyclical.
The table points to a company with solid quality and decent value characteristics, but weaker recent market momentum. Profitability stands out: return on invested capital, return on assets, operating margin, and profit margin all sit above sector medians. Leverage also looks restrained, with debt metrics notably better than many peers. On valuation, earnings and cash-flow-based measures appear supportive rather than stretched, even if price-to-book is somewhat richer than the sector median. Growth indicators are more mixed because recent recovery has improved the short-term trend, while the longer five-year revenue and earnings record still reflects the sector’s boom-and-bust cycle.
Growth
Range Resources operates in a sector that still has long-term relevance, but the growth case is very specific. It is not a broad energy-transition winner in the way a utility or equipment supplier might be. Instead, its future is tied to the role of U.S. natural gas as a relatively low-cost fuel for power generation, industrial use, petrochemicals, and liquefied natural gas exports. As more LNG export capacity comes online in North America over the next several years, Appalachian gas producers like Range could benefit from stronger structural demand, even if local pricing remains volatile from time to time.
The company’s strategy is fairly straightforward and makes sense for this type of business: concentrate on a large, well-known asset base, keep drilling efficient, protect margins, and return more cash once the balance sheet is under control. Range has spent years improving debt levels, and that creates more flexibility to let stronger cash generation flow toward shareholder returns or disciplined development rather than repair work.
Revenue growth has been extremely uneven, which is normal for a commodity producer. After the surge tied to strong gas prices in 2021 and parts of 2022, the company went through a sharp slowdown and then returned to positive year-over-year growth. More recently, the growth rate has stayed positive, but at a more moderate pace. That suggests the business has moved out of the downturn phase, though not into a straight-line expansion.
Free cash flow is one of the more encouraging parts of the picture. It dropped heavily during weaker pricing conditions, then rebounded to well above $1 billion on a trailing basis. For a producer like Range, that matters because free cash flow is the clearest proof that acreage quality and cost discipline are converting into real financial capacity rather than just accounting profit.
A meaningful catalyst for the company is the continued buildout of LNG export demand in the United States. Even though Range produces in Appalachia rather than directly on the Gulf Coast, a larger national market for gas can improve overall price support. Another catalyst is the company’s high-margin liquids and gas mix from core Marcellus acreage, which can make future production more valuable if pricing improves. Recent company communications have also emphasized capital discipline, operational efficiency, and shareholder return capacity, which are important in a sector where overproduction has often destroyed value in past cycles.
Risks
This article is for informational purposes only and does not constitute financial advice. Some content is AI-generated. See Disclaimer


