Stock Analysis · Zymeworks Inc (ZYME)
Overview
Zymeworks Inc is a biotechnology company focused on developing cancer medicines, especially antibody-based therapies. In simple terms, it designs and advances drugs that help the immune system recognize and fight tumors more effectively. The company’s pipeline is centered on oncology, with lead programs targeting difficult-to-treat solid tumors. Zymeworks is not yet a large commercial drug seller; its business model still depends mainly on drug development, partnerships, and milestone-based payments rather than broad recurring product sales.
Its revenue base is therefore more uneven than that of an established pharmaceutical company. Based on recent annual reporting, revenue comes primarily from collaboration and licensing arrangements, plus development-related milestones and other research support. Product sales are still limited relative to these partnership streams.
- Collaboration and license revenue: approximately 70% to 90% of recent annual revenue. This generally includes upfront payments, technology access fees, recognition of previously signed licensing agreements, and research collaboration payments from partners.
- Milestone revenue: approximately 10% to 30% depending on the year. This reflects payments tied to development, regulatory, or other contractual achievements and can swing sharply from one period to another.
- Other revenue, including product-related or service elements: typically 0% to 10%. This is currently not the core economic driver.
The business profile is important for long-term analysis: Zymeworks can post strong revenue in one period and much weaker revenue in the next, not necessarily because its science changed, but because accounting for partnerships and milestone events is lumpy by nature.
Over the last several years, the company’s cost structure has been dominated by research and development. That is typical for a clinical-stage biotech, but it also means operating results remain heavily dependent on pipeline progress and deal activity rather than stable commercial demand. Recent annual patterns suggest revenue improved from 2024 to 2025 while losses narrowed, helped by lower overall cash burn than in earlier years, although profitability remains out of reach for now.
The overall pattern shows a company still spending more on research and operations than it brings in from recurring business activity. R&D remains the largest expense line, while yearly revenue can move sharply because partnership payments do not arrive evenly.
Key Figures
| Metric | Value | Sector ⓘ |
|---|---|---|
| Date | Oct 17, 2026 | |
| Context | ||
| Sector | Healthcare | |
| Industry | Biotechnology | |
| Market Cap ⓘ | $1.78B | |
| Beta ⓘ | 1.17 | |
Value (Cheapness) | ||
| P/E Ratio ⓘ | N/A | 24.79 |
| P/B Ratio ⓘ | 23.39 | 3.08 |
| FCF Yield ⓘ | -6.75% | 3.15% |
| Dividend Yield ⓘ | N/A | 1.94% |
| EBIT / EV ⓘ | -8.72% | 0.57% |
| PEG ⓘ | N/A | |
Growth (Business expansion) | ||
| Revenue Growth ⓘ | -90.60% | 7.45% |
| RPS Growth (5Y CAGR) ⓘ | 28.76% | 8.61% |
| EPS Growth (5Y CAGR) ⓘ | N/A | -17.81% |
| BVPS Growth (5Y CAGR) ⓘ | -7.07% | 3.72% |
| Margin Growth (5Y Trend) ⓘ | N/A | -0.62% |
| FCF Growth (5Y CAGR) ⓘ | -36.00% | 1.04% |
| DPS Growth (5Y CAGR) ⓘ | 423.62% | 6.77% |
Quality (Business durability) | ||
| ROIC (Latest) ⓘ | -55.96% | 3.24% |
| ROA (Latest) ⓘ | -37.77% | 3.01% |
| ROIC (5Y Median) ⓘ | -22.48% | 4.60% |
| ROA (5Y Median) ⓘ | -20.04% | 1.89% |
| Net Debt / EBIT (Latest) ⓘ | N/A | 1.34 |
| Net Debt / EBIT (5Y Median) ⓘ | N/A | 1.84 |
| Net Debt / EBITDA (Latest) ⓘ | N/A | 1.00 |
| Net Debt / Assets ⓘ | 22.48% | 5.45% |
| EBITDA / Interest ⓘ | N/A | 9.64 |
| Operating Margin (Latest) ⓘ | -402.20% | 9.27% |
| Operating Margin (5Y Median) ⓘ | -157.03% | 7.38% |
| Debt to Equity (Latest) ⓘ | 334.26% | 28.58% |
| Profit Margin (Latest) ⓘ | N/A | 3.59% |
| Free Cash Flow (Latest) ⓘ | -$120.04M | |
Momentum (Price trend) | ||
| 3Y Return ⓘ | +265.25% | +42.80% |
| 12M Return (excl. last month) ⓘ | +63.53% | +18.50% |
| 6M Return ⓘ | -7.14% | +7.57% |
| Price vs. 200-Day MA ⓘ | +2.78% | +5.12% |
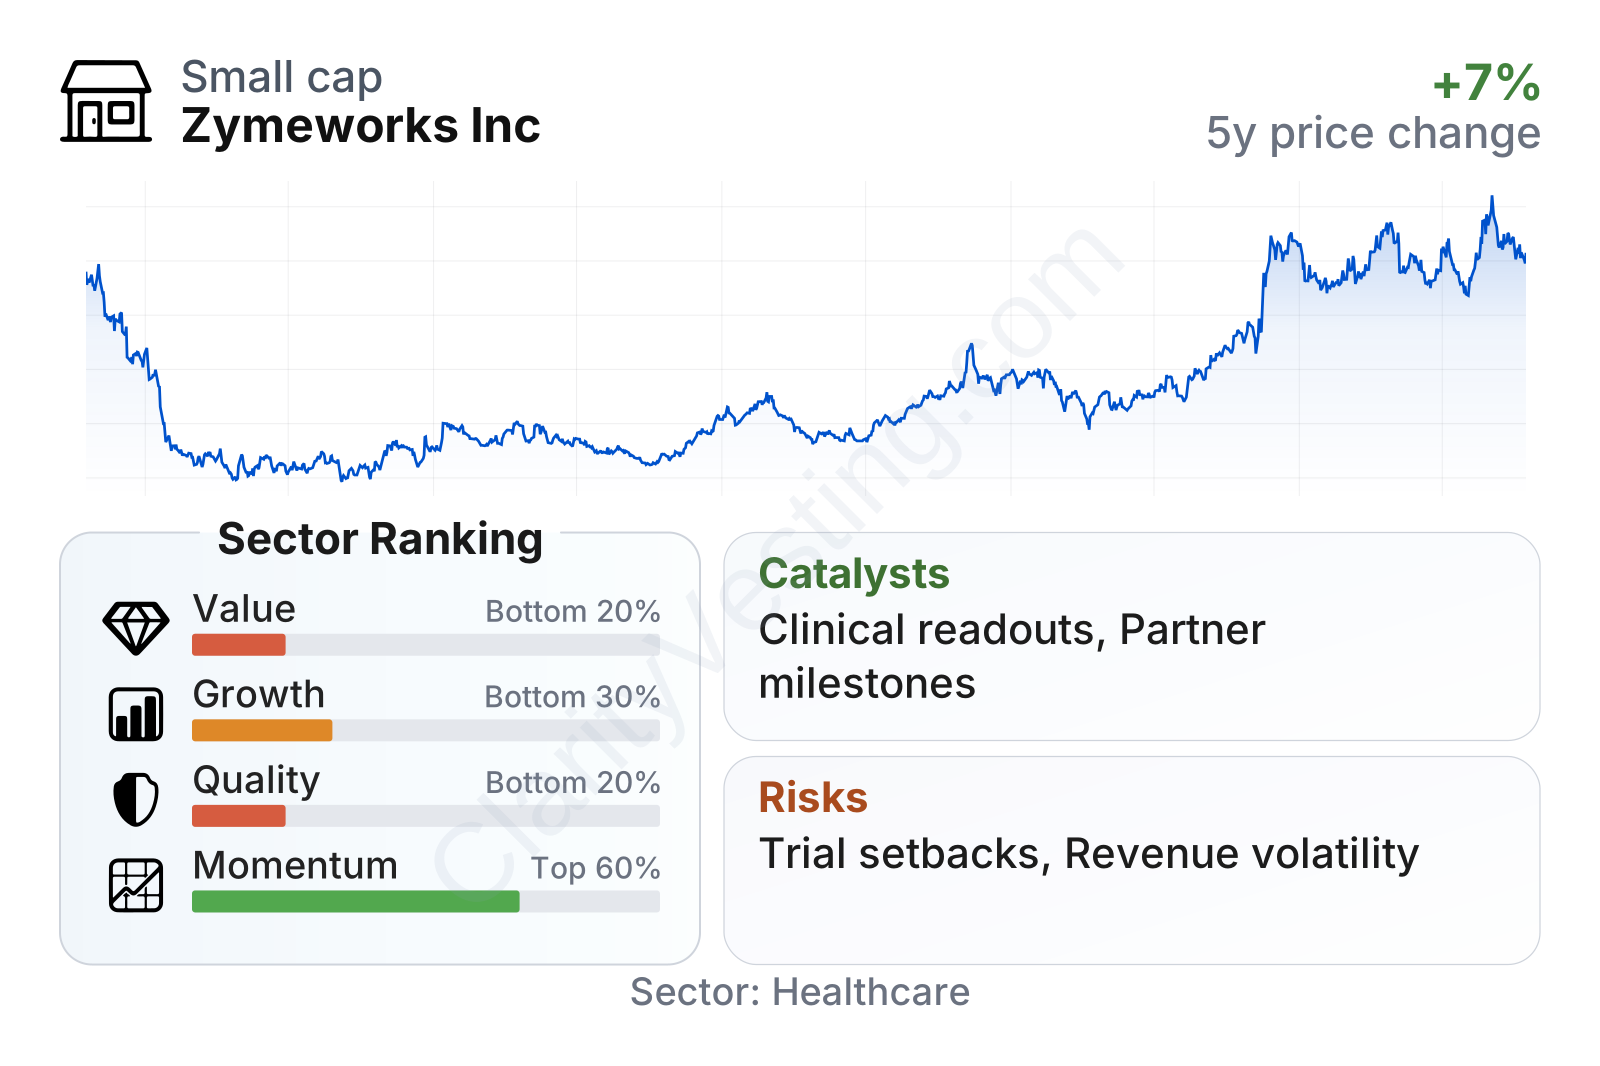
Zymeworks is a mid-sized biotech by market value, with share-price volatility somewhat above the broader market. The factor table points to a business that currently ranks weakly on value, quality, and near-term growth versus the healthcare sector, while price momentum has been much stronger than many peers. That combination usually reflects market optimism around pipeline progress despite ongoing losses and inconsistent revenue recognition.
The stock’s multi-year performance has been dramatic. After a steep decline earlier in the period shown, the shares recovered strongly through 2025 and into 2026. That kind of move is common in biotech when expectations around clinical assets, partnerships, or strategic repositioning improve, but it also signals that sentiment can change quickly.
Growth
Zymeworks operates in oncology, one of the largest and most active areas in biotechnology. Cancer drug development continues to attract heavy industry spending because medical need remains high and successful products can become major global franchises. Within that broad market, antibody-based therapies are especially important because they can be used alone, in combinations, or as building blocks for next-generation treatment formats.
The company’s strategy is logical for a development-stage biotech: concentrate capital on a focused pipeline, use partnerships to expand reach, and create optionality through licensing and milestone economics. Zymeworks has been sharpening that approach around lead clinical programs while also using its platform capabilities to support external collaborations. For a company of its size, this is a sensible structure because it reduces dependence on a single path to monetization.
Revenue growth has been highly volatile rather than steadily compounding. There were periods of very large jumps followed by sharp declines, and the most recent year-over-year readings were deeply negative. That does not automatically mean the underlying business is deteriorating; in biotech, it often means prior-period collaboration or milestone revenue created a difficult comparison. Still, it confirms that top-line growth cannot yet be treated as stable.
Cash generation remains negative, but the burn rate has been less severe than during the company’s earlier development phase. That matters because biotech balance sheets are often defined by how long cash can fund trials before new financing becomes necessary. If Zymeworks can keep spending disciplined while advancing key programs, the current setup gives it more room than a typical high-burn clinical biotech.
A major catalyst for future growth would be positive clinical data from lead oncology candidates, particularly if it expands the commercial relevance of those assets or supports larger partnership terms. Another meaningful opportunity would be regulatory progress that moves a program closer to commercialization, because the company’s economics would start shifting from research-stage uncertainty toward more visible product potential. Additional business development deals could also unlock value, especially if they validate the underlying technology with new counterparties.
Recent company updates have continued to emphasize pipeline execution, clinical enrollment progress, and development milestones across key programs. For a company like Zymeworks, these events matter more than broad industry headlines because each successful step can directly improve negotiating leverage, strategic credibility, and the probability of future non-dilutive cash inflows.
Risks
This article is for informational purposes only and does not constitute financial advice. Some content is AI-generated. See Disclaimer


