Stock Analysis · Zions Bancorporation (ZION)
Overview
Zions Bancorporation is a regional U.S. bank focused on business banking, commercial real estate lending, small and middle-market companies, and consumer banking across Western and Southwestern states. The group operates through well-known local brands in markets such as Utah, Texas, California, Arizona, Nevada, Colorado, and Washington. Its role is straightforward: it gathers deposits from customers, makes loans, provides treasury and payment services, and earns fees from banking activities.
For a bank like Zions, revenue does not come from selling products in the usual sense. It mainly comes from interest earned on loans and securities, plus fees tied to customer activity. Based on the company’s recent annual reporting structure, the main sources of revenue can be summarized as follows:
- Net interest income: approximately 75% to 85% of total revenue in a normal year. This is the spread between what Zions earns on loans and securities and what it pays on deposits and other funding.
- Noninterest income: approximately 15% to 25% of total revenue. This includes service charges and fees on deposit accounts, card and payment-related fees, capital markets and foreign exchange activity, trust and wealth management fees, and other banking service income.
- Within lending exposure, commercial customers dominate. The loan book is centered on commercial and industrial loans, owner-occupied and investor commercial real estate, municipal and public finance, and residential mortgage-related activity to a much smaller extent than large national consumer banks.
This revenue mix matters for long-term analysis because Zions is more tied to regional business activity and interest-rate conditions than to consumer credit card growth or investment banking cycles. It is a classic spread-based bank, with fee income providing support but not fully driving the business.
The multi-year income flow also shows a useful pattern: revenue expanded strongly after 2022, but profitability was pressured in 2023 and 2024 as funding costs rose sharply. Results improved again in 2025, suggesting the core franchise remained intact even after the regional banking stress period.
Key Figures
| Metric | Value | Sector ⓘ |
|---|---|---|
| Date | Oct 24, 2026 | |
| Context | ||
| Sector | Financial Services | |
| Industry | Banks - Regional | |
| Market Cap ⓘ | $9.69B | |
| Beta ⓘ | 0.83 | |
Value (Cheapness) | ||
| P/E Ratio ⓘ | 8.15 | 12.46 |
| P/B Ratio ⓘ | 1.25 | 1.25 |
| FCF Yield ⓘ | 21.14% | 9.82% |
| Dividend Yield ⓘ | 2.78% | 2.94% |
| EBIT / EV ⓘ | 16.59% | 8.11% |
| PEG ⓘ | 3.98 | |
Growth (Business expansion) | ||
| Revenue Growth ⓘ | 9.50% | 9.10% |
| RPS Growth (5Y CAGR) ⓘ | 16.03% | 12.31% |
| EPS Growth (5Y CAGR) ⓘ | -3.58% | -6.97% |
| BVPS Growth (5Y CAGR) ⓘ | -45.97% | 5.02% |
| Margin Growth (5Y Trend) ⓘ | -24.92% | -4.00% |
| FCF Growth (5Y CAGR) ⓘ | 23.40% | 4.71% |
| DPS Growth (5Y CAGR) ⓘ | 2.73% | 8.92% |
Quality (Business durability) | ||
| ROIC (Latest) ⓘ | 12.45% | 9.18% |
| ROE (Latest) ⓘ | 16.31% | 13.93% |
| ROA (Latest) ⓘ | 1.35% | 1.57% |
| ROIC (5Y Median) ⓘ | 10.95% | 7.80% |
| ROE (5Y Median) ⓘ | 13.27% | 12.15% |
| ROA (5Y Median) ⓘ | 0.99% | 1.28% |
| Net Debt / EBIT (Latest) ⓘ | 0.64 | 1.02 |
| Net Debt / EBIT (5Y Median) ⓘ | 1.24 | 0.72 |
| Net Debt / EBITDA (Latest) ⓘ | -0.61 | 0.88 |
| Operating Margin (Latest) ⓘ | 29.06% | 22.30% |
| Operating Margin (5Y Median) ⓘ | 23.77% | 24.50% |
| Debt to Equity (Latest) ⓘ | 42.41% | 59.34% |
| Profit Margin (Latest) ⓘ | 32.20% | 26.42% |
| Free Cash Flow (Latest) ⓘ | $2.05B | |
Momentum (Price trend) | ||
| 3Y Return ⓘ | +144.91% | +95.73% |
| 12M Return (excl. last month) ⓘ | +14.89% | +17.30% |
| 6M Return ⓘ | +8.72% | +6.07% |
| Price vs. 200-Day MA ⓘ | +5.23% | +5.36% |
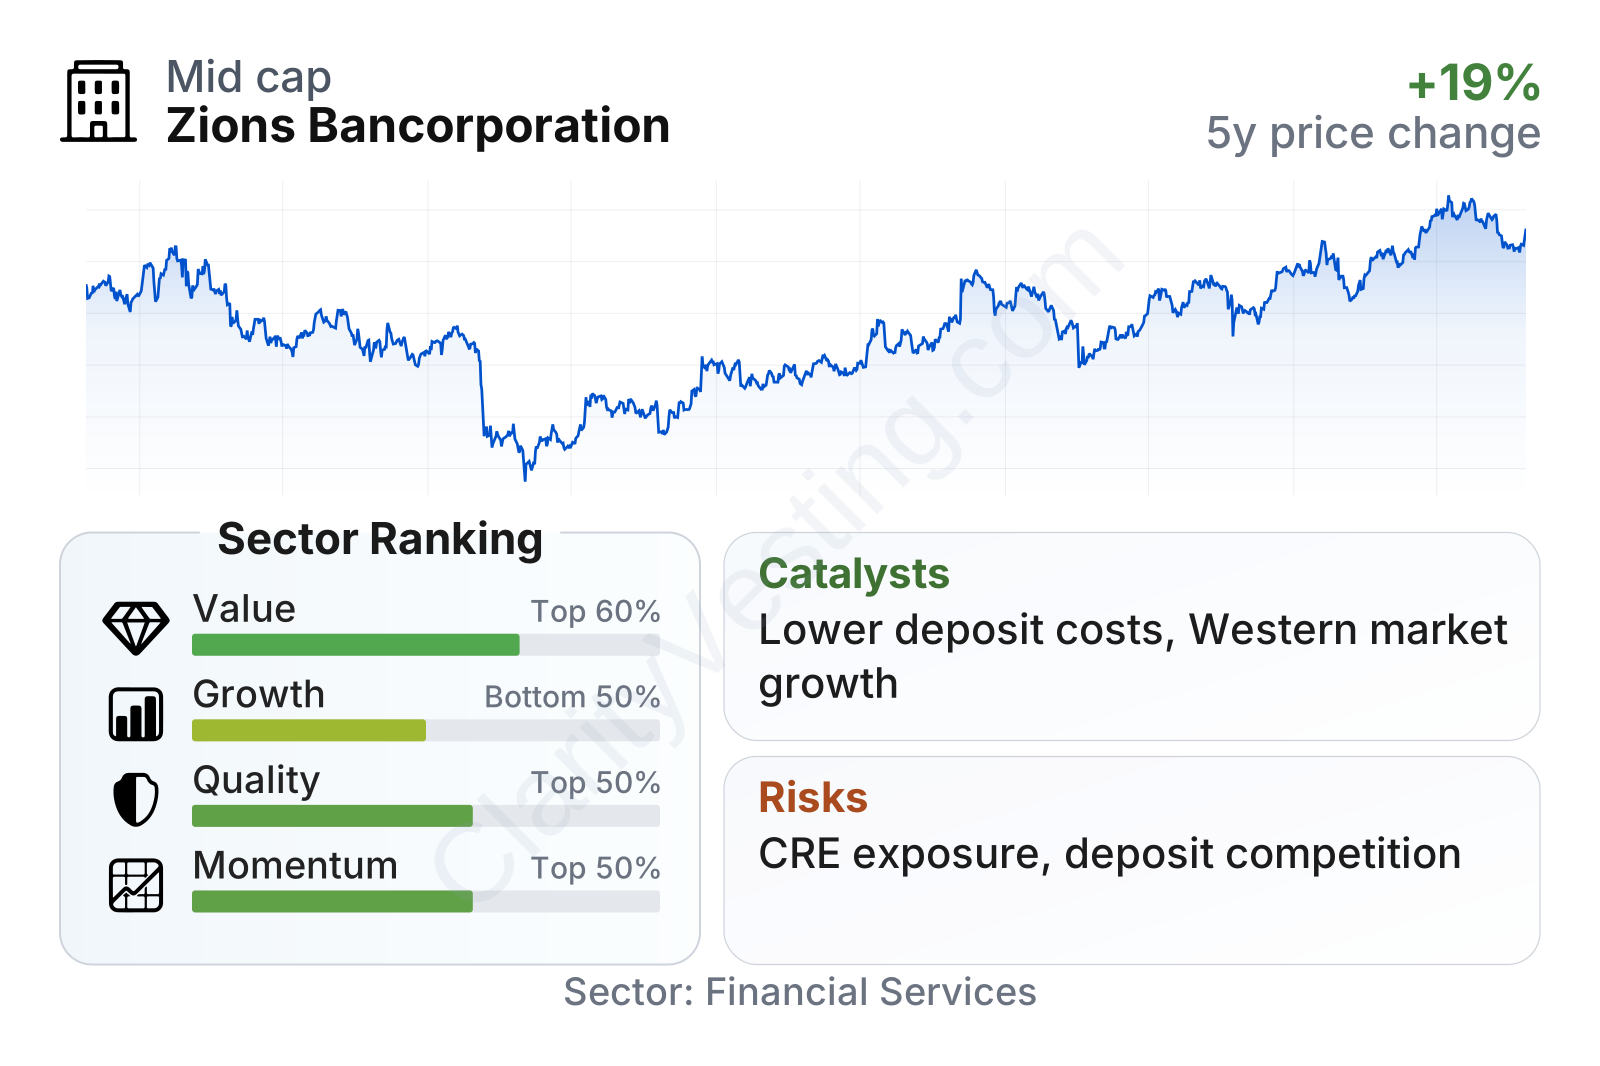
Zions is a mid-sized regional bank with a market value near $10 billion, so it is large enough to have scale but still small compared with national banking giants. The stock’s path over the last few years shows how sensitive sentiment can be for regional banks: it fell sharply during the 2023 banking turmoil, then recovered as deposit stability and earnings resilience became clearer.
The latest metrics point to a mixed but understandable profile. On valuation, the shares trade at an earnings multiple below the sector median, while the price-to-book ratio sits roughly in line with peers. Profitability looks solid on several measures, especially return on equity, operating margin, and profit margin. Growth is less convincing because some longer-term measures remain distorted by the 2023 stress period and by pressure on margins. Momentum is respectable, reflecting the stock’s recovery, but it is not dramatically ahead of the group in the most recent 12-month comparison.
Growth
Zions operates in a mature sector, not a high-growth one. Regional banking rarely offers rapid structural expansion, but it can still produce long-term progress through disciplined loan growth, deposit gathering, better pricing, and expansion of fee-based services. The more important question is whether the bank is positioned to grow profitably through cycles rather than simply grow fast.
Zions has several reasonable long-term growth drivers. Its footprint includes attractive states that have generally benefited from population gains, business formation, infrastructure spending, and above-average economic activity compared with many slower-growth regions. A commercial banking focus can be an advantage in these markets because local business customers often value relationship banking, credit expertise, and treasury services that are harder to commoditize than basic retail checking.
Management has also emphasized capital-light fee businesses alongside core lending. That strategy makes sense because treasury management, payments, foreign exchange, and wealth-related services can deepen relationships and reduce dependence on pure interest spreads. For a bank with a strong commercial orientation, this can gradually improve resilience over time.
Earnings trends show the main challenge and the recent improvement. Profit per share declined from the strong post-pandemic level into the 2023-2024 period, then recovered in 2025 and appears to have continued improving into 2026. That pattern fits what happened across the industry: deposit costs rose much faster than banks had enjoyed earlier in the rate cycle, compressing profitability before repricing and balance-sheet adaptation helped results recover.
Book value per share is especially important for banks because it reflects the equity base supporting the franchise. After unusual distortion in the earlier part of the series, the more recent direction has been positive, rising steadily from 2023 through 2025. That is a constructive sign because it suggests internal capital rebuilding and improving balance-sheet value after a difficult period for regional banks.
One practical catalyst is the easing of industry-wide pressure from deposit competition. If funding costs stabilize while asset yields remain relatively healthy, net interest income can improve without requiring aggressive balance-sheet growth. Another is continued economic strength in Zions’ regional markets, which supports loan demand and credit quality. Recent company updates in 2026 have also pointed to ongoing capital strength, balance-sheet discipline, and room for shareholder distributions, which signals confidence in the underlying earnings base even though that is not the same as guaranteed growth.
Risks
This article is for informational purposes only and does not constitute financial advice. Some content is AI-generated. See Disclaimer


