Stock Analysis · Zijin Mining Group Co Ltd (ZIJMY)
Overview
Zijin Mining Group Co. Ltd. is a large Chinese mining company focused on metals that are important for both traditional industry and the energy transition. The group explores, develops, mines, processes, and sells mineral resources, with a strong presence in gold, copper, zinc, and lithium. Its assets are spread across China and several overseas regions, which gives it exposure to multiple ore bodies and end markets rather than relying on one single mine.
For long-term analysis, the business is easiest to understand as a combination of two major profit engines: precious metals, especially gold, and base metals, especially copper. Gold helps when inflation, geopolitical stress, or central-bank demand support prices. Copper matters because it is used in power grids, electric vehicles, renewable energy systems, construction, and industrial equipment. That mix gives Zijin exposure to both defensive and growth-oriented commodity demand.
Based on the company’s recent annual reporting structure, the main sources of revenue are approximately the following:
- Gold-related products: about 49% of revenue. This includes mined gold and processed gold products sold by the group.
- Copper-related products: about 26% of revenue. This includes copper concentrates, blister copper, cathode copper, and other copper materials.
- Zinc, lead, and other base-metal products: about 12% of revenue. This typically includes zinc concentrate, zinc ingots, and related by-products.
- Other products and services, including trading and smaller mineral categories such as silver, molybdenum, and lithium-related activities: about 13% of revenue.
The revenue mix matters because it shows Zijin is not a pure gold producer. It is increasingly a broader metals company, with copper becoming more strategically important. That matters for long-term positioning because copper and battery-related materials are tied to electrification, while gold remains an important source of cash generation and diversification.
The company’s profit structure has also improved visibly in recent years. Revenue has risen, but operating income and net income have grown even faster, which suggests better pricing, richer product mix, improved mine contributions, or stronger cost control. That is usually a healthier sign than growth driven only by volume.
The business flow shows a notable expansion in profitability over time: revenue has increased steadily, but gross profit, operating income, and net income have expanded at a faster pace. That points to improving economics rather than simple scale alone.
Key Figures
| Metric | Value | Sector ⓘ |
|---|---|---|
| Date | Nov 12, 2026 | |
| Context | ||
| Sector | Basic Materials | |
| Industry | Gold | |
| Market Cap ⓘ | $96.44B | |
| Beta ⓘ | 1.00 | |
Value (Cheapness) | ||
| P/E Ratio ⓘ | 9.54 | 16.36 |
| P/B Ratio ⓘ | N/A | 2.39 |
| FCF Yield ⓘ | 11.46% | 5.13% |
| Dividend Yield ⓘ | 3.23% | 1.93% |
| EBIT / EV ⓘ | 15.15% | 7.80% |
| PEG ⓘ | 1.05 | |
Growth (Business expansion) | ||
| Revenue Growth ⓘ | 3.20% | 11.40% |
| RPS Growth (5Y CAGR) ⓘ | 9.13% | 4.52% |
| EPS Growth (5Y CAGR) ⓘ | 30.16% | -8.98% |
| BVPS Growth (5Y CAGR) ⓘ | 12.67% | 5.55% |
| Margin Growth (5Y Trend) ⓘ | 10.21% | -1.48% |
| FCF Growth (5Y CAGR) ⓘ | 65.46% | 0.40% |
| DPS Growth (5Y CAGR) ⓘ | 24.12% | 6.02% |
Quality (Business durability) | ||
| ROIC (Latest) ⓘ | 27.00% | 9.26% |
| ROA (Latest) ⓘ | 13.27% | 5.01% |
| ROIC (5Y Median) ⓘ | 16.28% | 7.95% |
| ROA (5Y Median) ⓘ | 8.02% | 3.88% |
| Net Debt / EBIT (Latest) ⓘ | 0.73 | 1.25 |
| Net Debt / EBIT (5Y Median) ⓘ | 2.18 | 1.65 |
| Net Debt / EBITDA (Latest) ⓘ | 0.69 | 0.94 |
| Net Debt / Assets ⓘ | 15.67% | 12.26% |
| EBITDA / Interest ⓘ | 32.79 | 13.02 |
| Operating Margin (Latest) ⓘ | 31.97% | 13.20% |
| Operating Margin (5Y Median) ⓘ | 11.29% | 11.86% |
| Debt to Equity (Latest) ⓘ | 85.36% | 40.38% |
| Profit Margin (Latest) ⓘ | 18.88% | 6.68% |
| Free Cash Flow (Latest) ⓘ | $11.05B | |
Momentum (Price trend) | ||
| 3Y Return ⓘ | +160.71% | +60.19% |
| 12M Return (excl. last month) ⓘ | -2.40% | +19.57% |
| 6M Return ⓘ | -24.38% | -5.86% |
| Price vs. 200-Day MA ⓘ | -17.65% | -1.23% |
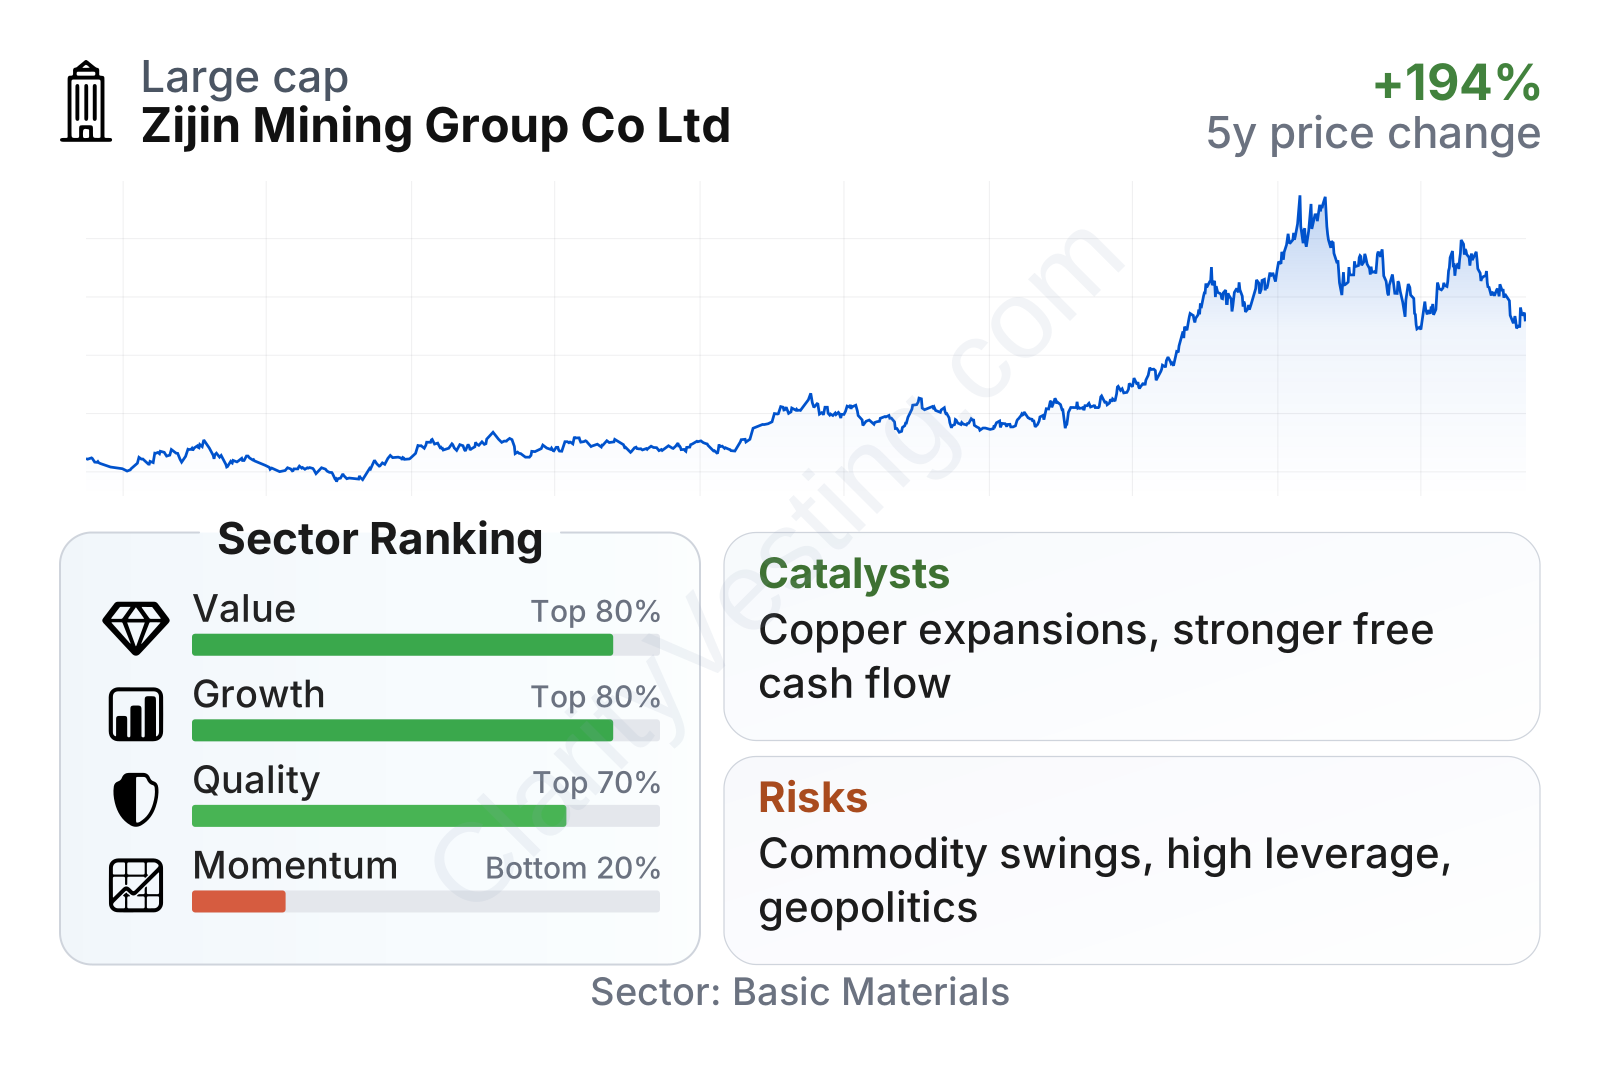
Zijin is a very large mining company by market value, with share-price volatility close to the broader market rather than an extreme outlier. The overall snapshot is unusual in a favorable way: valuation looks inexpensive relative to many peers, quality metrics are strong, and long-term growth metrics are well above sector norms. The weaker area is recent price momentum, as the stock has pulled back meaningfully after a very strong multi-year run. That combination often reflects a business that still screens well fundamentally even though market enthusiasm has cooled in the short term.
Growth
Zijin operates in a sector with long-term structural support, especially on the copper side. Copper demand is linked to power transmission, electric vehicles, charging infrastructure, renewable generation, and grid upgrades. Gold has a different demand pattern, but it benefits from central-bank purchases, reserve diversification, inflation concerns, and its role as a store of value. Lithium is a smaller part of the current business, yet it adds optionality tied to battery supply chains.
The company’s strategy also makes industrial sense. Instead of staying concentrated in one metal or one country, Zijin has built a broader mining portfolio through exploration, mine development, and international acquisitions. For a miner, this can create long-duration growth if the acquired assets are high quality and can be brought into production at acceptable cost. The challenge is always execution, but the strategic direction itself is coherent: own more long-life copper and gold assets, improve processing capability, and keep expanding reserves and output.
Revenue growth has not been smooth quarter to quarter, which is normal in mining because metal prices, grades, shipment timing, and consolidation effects can move results around. Even so, the broader pattern remains positive. Recent year-over-year growth has slowed from earlier peaks, but the longer-term record still shows meaningful expansion.
Cash generation has improved sharply. Free cash flow moved from weakness earlier in the cycle to a much stronger level more recently, which is an important signal for a capital-intensive company. In mining, accounting earnings matter, but free cash flow matters more because mines require heavy ongoing spending. Rising free cash flow gives the company more room to fund new projects, reduce leverage pressure, and maintain shareholder distributions without relying as heavily on external financing.
Recent corporate developments have continued to support the long-term growth case. The company has kept advancing major copper and gold assets and has remained active in resource expansion and overseas development. For Zijin, the strongest catalysts are usually not one-day headlines but multi-year commissioning, expansion, and ramp-up cycles at large mines. If those projects deliver as planned, production and reserve life can keep improving over several years rather than one quarter.
Risks
This article is for informational purposes only and does not constitute financial advice. Some content is AI-generated. See Disclaimer