Stock Analysis · YTL Corporation Berhad (YTLCF)
Overview
YTL Corporation Berhad is a Malaysian infrastructure and utilities group with operations that extend beyond classic regulated power and water assets. The company owns and develops businesses in electricity generation, water and sewerage services, telecommunications and digital infrastructure, construction, cement and building materials, and property development. That mix makes YTL broader than a typical utility: part of the business is defensive and recurring, while other parts are more cyclical and tied to construction activity, real estate demand, and large capital projects.
Based on the group’s recent annual disclosures, revenue is spread across several operating segments rather than relying on a single business line. The approximate ranking of major revenue sources is as follows:
- Construction and materials: roughly 30% to 35% of group revenue. This includes construction contracting, cement, ready-mix concrete, and other building materials.
- Utilities: roughly 25% to 30%. This generally includes power generation as well as water and sewerage-related services.
- Hotels, property, and related services: roughly 20% to 25%. This covers property development, asset ownership, hospitality, and associated services.
- Telecommunications and digital infrastructure: roughly 10% to 15%. This includes mobile and broadband services as well as data-center-related activities through group subsidiaries and affiliates.
- Management services and other operations: the remaining share, typically in the low-to-mid single teens when combined, depending on project timing and consolidation.
This structure matters for long-term analysis. Utilities can provide steadier cash generation, while construction, cement, and property can lift growth when the economic cycle is favorable. The trade-off is that group results can be harder to read than those of a pure-play regulated utility.
Over the last several years, group revenue has trended upward overall, moving from about $6.0 billion in fiscal 2022 to nearly $7.8 billion in fiscal 2026. Operating profit also improved materially from 2022 through 2024, although net income softened more recently as costs and margins became less favorable. The broad pattern is one of expansion in sales with more pressure at the bottom line.
The business mix shows why profitability can fluctuate. Revenue has continued to edge higher, but costs remain heavy, interest expense is meaningful, and net income has not risen in line with sales. That is typical of a capital-intensive group operating across utilities, infrastructure, and development activities.
Key Figures
| Metric | Value | Sector ⓘ |
|---|---|---|
| Date | Nov 12, 2026 | |
| Context | ||
| Sector | Utilities | |
| Industry | Utilities - Diversified | |
| Market Cap ⓘ | $6.14B | |
| Beta ⓘ | 0.30 | |
Value (Cheapness) | ||
| P/E Ratio ⓘ | 17.44 | 17.73 |
| P/B Ratio ⓘ | N/A | 1.95 |
| FCF Yield ⓘ | -13.53% | -0.52% |
| Dividend Yield ⓘ | 11.47% | 3.52% |
| EBIT / EV ⓘ | 10.38% | 5.78% |
| PEG ⓘ | 1.48 | |
Growth (Business expansion) | ||
| Revenue Growth ⓘ | 15.50% | 8.30% |
| RPS Growth (5Y CAGR) ⓘ | 5.32% | 3.61% |
| EPS Growth (5Y CAGR) ⓘ | 26.23% | -2.45% |
| BVPS Growth (5Y CAGR) ⓘ | -15.42% | 4.14% |
| Margin Growth (5Y Trend) ⓘ | 3.34% | 3.59% |
| FCF Growth (5Y CAGR) ⓘ | N/A | -8.59% |
| DPS Growth (5Y CAGR) ⓘ | 18.78% | 4.81% |
Quality (Business durability) | ||
| ROIC (Latest) ⓘ | 7.05% | 6.57% |
| ROA (Latest) ⓘ | 1.43% | 3.14% |
| ROIC (5Y Median) ⓘ | 8.35% | 5.92% |
| ROA (5Y Median) ⓘ | 1.43% | 2.74% |
| Net Debt / EBIT (Latest) ⓘ | 6.11 | 6.90 |
| Net Debt / EBIT (5Y Median) ⓘ | 6.68 | 7.25 |
| Net Debt / EBITDA (Latest) ⓘ | 4.28 | 4.25 |
| Net Debt / Assets ⓘ | 37.98% | 38.00% |
| EBITDA / Interest ⓘ | 3.96 | 4.58 |
| Operating Margin (Latest) ⓘ | 20.25% | 20.25% |
| Operating Margin (5Y Median) ⓘ | 21.68% | 19.99% |
| Debt to Equity (Latest) ⓘ | N/A | 137.35% |
| Profit Margin (Latest) ⓘ | 4.53% | 10.44% |
| Free Cash Flow (Latest) ⓘ | -$830.73M | |
Momentum (Price trend) | ||
| 3Y Return ⓘ | +38.77% | +55.31% |
| 12M Return (excl. last month) ⓘ | -18.92% | +6.67% |
| 6M Return ⓘ | +32.62% | 0.00% |
| Price vs. 200-Day MA ⓘ | N/A | +2.26% |
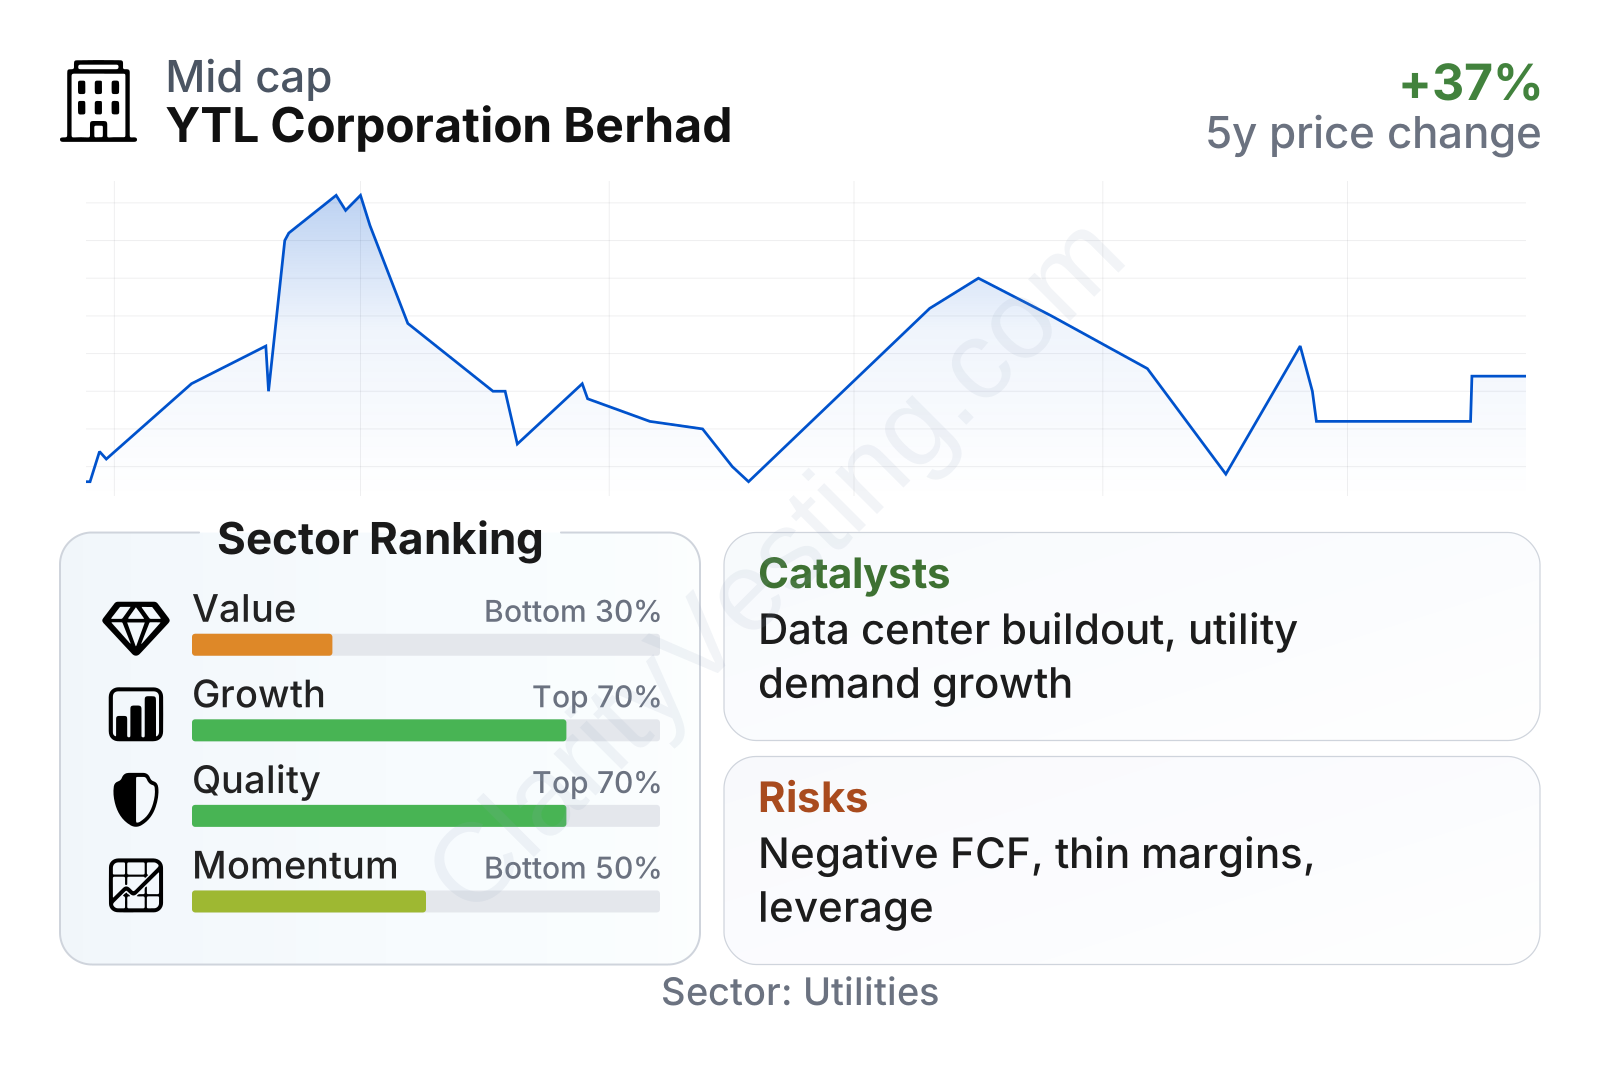
YTL sits in the large-cap range for its market, and its share price volatility has been low, with a beta around 0.30. Relative to utility peers, valuation looks mixed rather than clearly cheap or clearly expensive. Its earnings multiple is close to the sector median, dividend yield is notably higher than the median, and its EBIT-to-enterprise-value measure is stronger than average. On the other hand, free cash flow has turned negative, which weakens the value case. Quality and growth indicators are above the sector median overall, helped by solid multi-year earnings expansion and acceptable returns on invested capital, while momentum has been softer over the past year.
Growth
YTL operates in sectors that should remain relevant for many years: electricity, water, communications, digital infrastructure, and urban development. Among these, the most important long-term growth themes are power demand, connectivity, and data-center infrastructure. Those areas are benefiting from structural drivers rather than only short-term economic cycles. Rising electricity consumption, cloud services, and AI-related computing needs can support demand for both power capacity and digital facilities, especially in Southeast Asia and selected overseas markets where YTL has operating exposure.
The group’s strategy also makes industrial sense. It combines long-life infrastructure assets with adjacent businesses that can capture project value across the chain. A company involved in utilities, cement, construction, and property can participate not just in operating assets, but also in building them. If management allocates capital well, that structure can create recurring earnings from utilities while using construction and materials units to benefit from internal and external infrastructure spending.
Recent corporate updates have highlighted continued interest in data-center and digital infrastructure development in Malaysia, an area where YTL has been building visibility through its broader ecosystem. This is one of the clearest catalysts because it links multiple businesses at once: land, power access, connectivity, and construction capability. In practical terms, data-center demand can support utility load growth, telecom activity, and project work across the group.
Revenue per share has improved meaningfully over the full five-year period, although the pace has flattened since fiscal 2024. That suggests the group has already captured a substantial part of its recent topline expansion, and the next phase likely depends less on simple recovery and more on new capacity, project execution, and higher-value business mix.
Cash generation is the key issue to watch within the growth picture. Free cash flow was positive at a healthy level before dropping sharply into negative territory more recently. For an infrastructure-heavy group, negative free cash flow is not automatically a sign of weakness if it reflects expansion spending that can produce future earnings. Still, it means growth currently appears more investment-led than cash-funded, which raises the importance of project returns and financing discipline.
Risks
This article is for informational purposes only and does not constitute financial advice. Some content is AI-generated. See Disclaimer