Stock Analysis · York Space Systems Inc (YSS)
Overview
York Space Systems Inc operates in aerospace and defense, with a business centered on small satellites and space mission systems. The company is best known for designing and producing satellite platforms, often described as spacecraft buses, and for integrating those systems into broader national security, civil, and commercial missions. In simple terms, it helps customers put useful equipment into orbit through standardized satellite designs intended to be faster and less expensive to produce than traditional custom-built spacecraft.
Its revenue appears to come primarily from product sales and mission-related services tied to satellite programs. Based on the company’s business model and public descriptions of its activities, the main revenue streams are likely organized as follows:
- Satellite platform sales and spacecraft manufacturing: the largest source of revenue, incorporating standardized satellite buses, payload integration, and production contracts for constellations and individual spacecraft.
- Mission integration and engineering services: systems engineering, design support, testing, program management, and other technical services attached to customer missions.
- Related space mission solutions: this can include ground support, operational support, and other contract work connected to satellite deployment and mission execution.
Publicly available material does not provide a reliable segment breakdown with exact percentages for these sources, so a precise revenue split should be treated as undisclosed rather than estimated too aggressively. What is clearer from the financial profile is that the company has been scaling revenue meaningfully, from about $238 million in 2023 to roughly $386 million in 2025, indicating that satellite production and associated contract execution have expanded quickly.
The operating structure also shows a business still absorbing high execution and overhead costs while it scales. Revenue increased strongly in 2025, gross profit improved from 2024 levels, and research spending remained material, but selling, general, and administrative costs stayed very high. That combination suggests a company still in the build-out phase rather than a mature, efficiently profitable aerospace supplier.
The financial flow highlights the main tension in the business: revenue growth has been strong, and gross profit recovered in 2025, but operating expenses and interest costs continue to consume too much of that progress. The company is growing its activity base faster than it is converting that growth into earnings.
Key Figures
| Metric | Value | Sector ⓘ |
|---|---|---|
| Date | Oct 17, 2026 | |
| Context | ||
| Sector | Industrials | |
| Industry | Aerospace & Defense | |
| Market Cap ⓘ | $1.19B | |
| Beta ⓘ | N/A | |
Value (Cheapness) | ||
| P/E Ratio ⓘ | N/A | 22.10 |
| P/B Ratio ⓘ | 0.63 | 1.97 |
| FCF Yield ⓘ | -18.45% | 6.38% |
| Dividend Yield ⓘ | N/A | 1.94% |
| EBIT / EV ⓘ | -13.10% | 4.79% |
| PEG ⓘ | N/A | |
Growth (Business expansion) | ||
| Revenue Growth ⓘ | 10.40% | 9.30% |
| RPS Growth (5Y CAGR) ⓘ | 16.90% | 7.81% |
| EPS Growth (5Y CAGR) ⓘ | N/A | -13.06% |
| BVPS Growth (5Y CAGR) ⓘ | -4.58% | 6.14% |
| Margin Growth (5Y Trend) ⓘ | N/A | 0.88% |
| FCF Growth (5Y CAGR) ⓘ | N/A | 11.01% |
| DPS Growth (5Y CAGR) ⓘ | N/A | 9.48% |
Quality (Business durability) | ||
| ROIC (Latest) ⓘ | -10.33% | 10.84% |
| ROA (Latest) ⓘ | -11.99% | 5.41% |
| ROIC (5Y Median) ⓘ | N/A | 9.38% |
| ROA (5Y Median) ⓘ | N/A | 4.95% |
| Net Debt / EBIT (Latest) ⓘ | N/A | 2.08 |
| Net Debt / EBIT (5Y Median) ⓘ | N/A | 2.27 |
| Net Debt / EBITDA (Latest) ⓘ | N/A | 1.39 |
| Net Debt / Assets ⓘ | -17.23% | 19.28% |
| EBITDA / Interest ⓘ | N/A | 9.58 |
| Operating Margin (Latest) ⓘ | -47.18% | 10.50% |
| Operating Margin (5Y Median) ⓘ | -17.89% | 10.29% |
| Debt to Equity (Latest) ⓘ | 10.16% | 65.48% |
| Profit Margin (Latest) ⓘ | -50.06% | 6.67% |
| Free Cash Flow (Latest) ⓘ | -$219.16M | |
Momentum (Price trend) | ||
| 3Y Return ⓘ | N/A | +61.68% |
| 12M Return (excl. last month) ⓘ | N/A | +12.58% |
| 6M Return ⓘ | -60.98% | 0.00% |
| Price vs. 200-Day MA ⓘ | N/A | +0.02% |
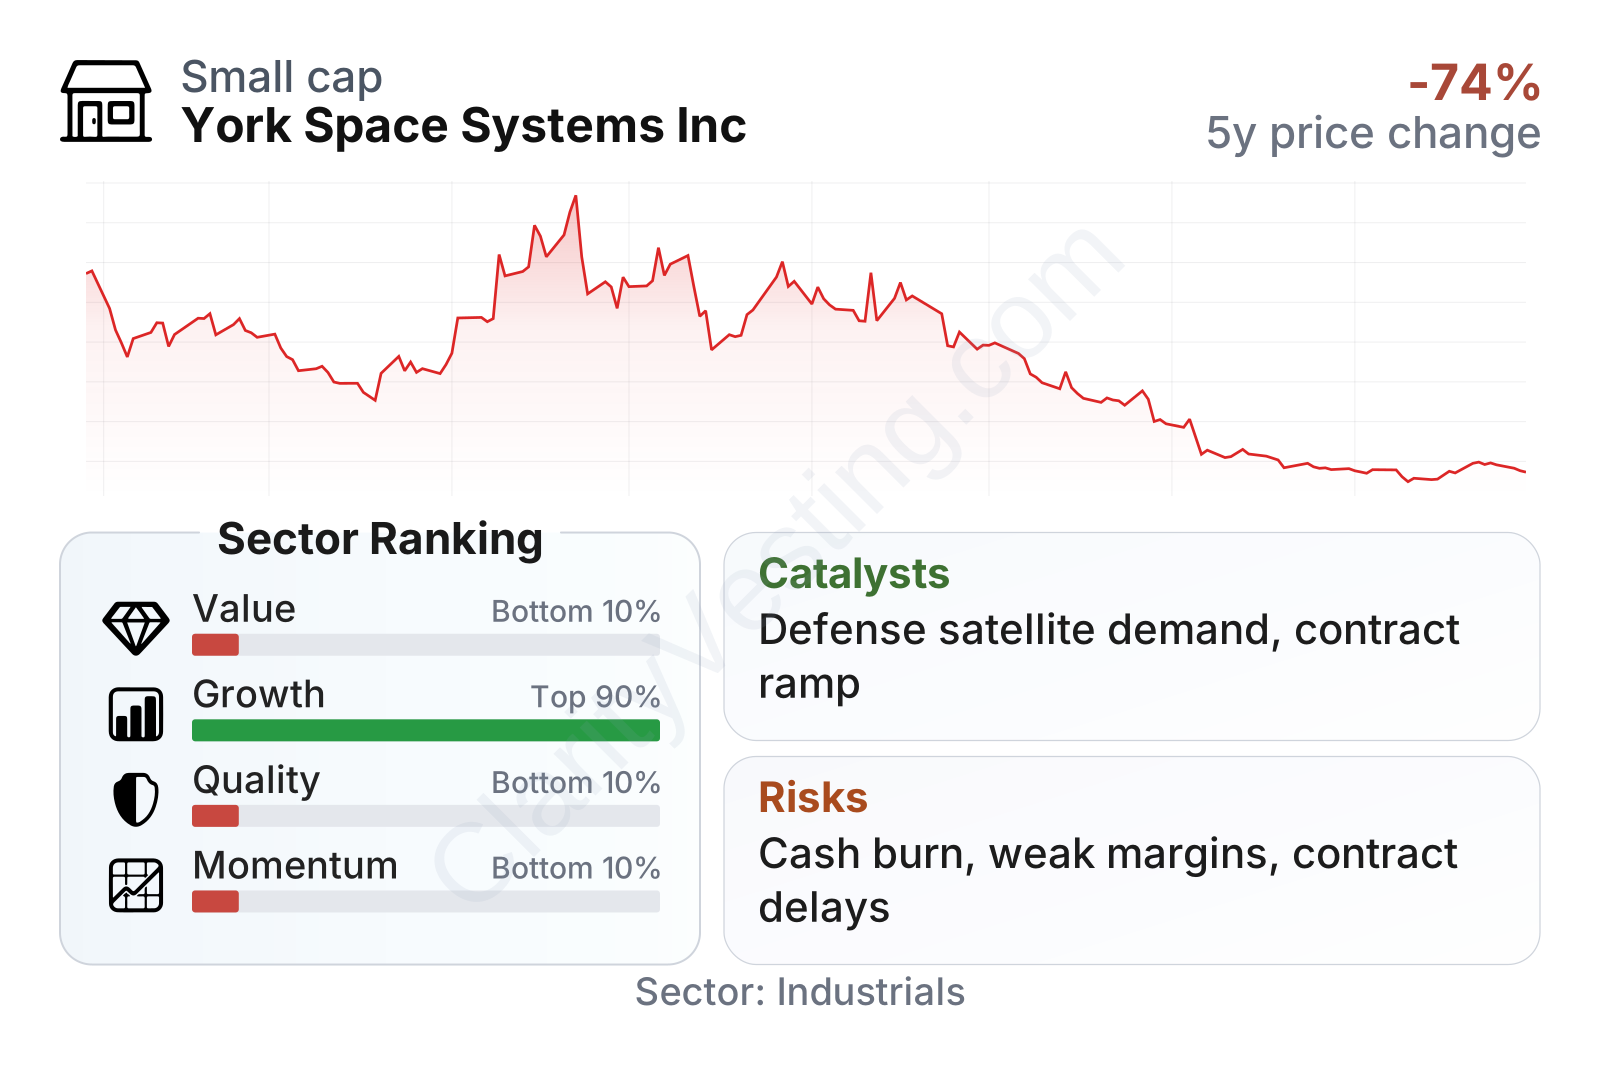
York is currently a small-cap aerospace and defense company. The stock has weakened sharply in recent months, with the share price dropping from the low-$30s at the start of 2026 to the mid-teens by late July. That decline fits with the company’s weak profitability, negative free cash flow, and low momentum relative to the broader industrial sector.
The metrics table points to a mixed profile. Growth stands out as one of the strongest areas, with recent revenue growth slightly above the sector median and five-year revenue-per-share growth well ahead of typical peers. By contrast, quality and value rank near the bottom of the sector. Profitability is deeply negative, returns on capital and assets are below normal industry levels, and free cash flow remains significantly negative. The low price-to-book ratio may look optically cheap, but that discount sits alongside heavy losses and weak operating efficiency, which limits how much comfort that single valuation metric can provide.
Growth
The company operates in a sector with long-term structural tailwinds. Demand for satellites is being supported by defense modernization, missile tracking, communications, Earth observation, and the broader shift toward proliferated constellations made up of many smaller spacecraft instead of a few very large ones. In that environment, York’s standardized manufacturing approach makes strategic sense. A repeatable platform can lower production time, support larger volumes, and fit well with government customers that want faster deployment cycles.
Its recent financial trajectory also supports the case that the underlying market opportunity is real. Revenue grew from about $254 million in 2024 to about $386 million in 2025, a gain of roughly 52%. That is materially faster than the latest year-over-year growth rate shown in the current metrics because annual comparisons can shift as new contracts ramp and timing effects move between quarters. Over a longer period, the growth trend is still clearly positive.
An important catalyst is the continued expansion of national security space spending in the United States. York has positioned itself around lower-cost, rapidly deployable satellite architectures, which align with how defense buyers increasingly think about resilience in orbit. If procurement continues shifting toward distributed constellations, that should remain a favorable backdrop for the company’s offering.
Another positive element is operating leverage potential. The current margin structure is weak, but the model could improve if manufacturing scale, contract mix, and factory utilization all move in the right direction. A business that standardizes hardware can see margins change quickly once volume rises and execution stabilizes. That does not mean improvement is guaranteed, only that the path to better economics is understandable.
Recent public company communications have emphasized contract activity, satellite production expansion, and support for government missions. Those developments matter because they reinforce York’s relevance in a strategically important niche: delivering space systems fast enough and at a cost point that fits the evolving defense market.
Risks
This article is for informational purposes only and does not constitute financial advice. Some content is AI-generated. See Disclaimer


