Stock Analysis · Yara International ASA (YRAIF)
Overview
Yara International ASA is a global crop nutrition company best known for nitrogen fertilizers, industrial chemicals linked to ammonia, and digital farming tools. In simple terms, Yara helps farmers increase crop yields and also sells nitrogen-based products to industrial customers. The business sits at the intersection of food production, energy costs, and environmental regulation because nitrogen fertilizer is essential for modern agriculture but expensive to produce.
Yara reports its business mainly through operating segments and product groups rather than a single simple consumer-facing model. Based on the company’s recent annual reporting, its revenue mix is broadly centered on fertilizer sales, with Europe and the Americas representing major end markets. A practical way to think about revenue sources is the following:
- Nitrogen fertilizers for agriculture: approximately 70% to 80% of revenue. This includes ammonia-based and nitrate-based fertilizers sold to growers and distributors.
- Industrial products: approximately 15% to 25% of revenue. This includes ammonia and related nitrogen products used in emissions control, chemicals, and other industrial applications.
- Crop nutrition programs and other solutions: a smaller share, generally in the low single-digit to low-teens range depending on classification. This includes specialty nutrition, agronomic services, and digital tools.
Geographically, Yara is diversified, with large exposure to Europe, Latin America, and North America, which helps reduce reliance on one farming region. The business model is also supported by global production, sourcing, trading, and distribution infrastructure. That network matters because fertilizer is a scale business: access to production assets, shipping, storage, and customer relationships can be as important as the product itself.
The multi-year financial picture shows how cyclical this company can be. Revenue surged in 2022 during the fertilizer price shock, then dropped sharply in 2023 and 2024 as prices normalized, before improving again in 2025. Even so, the latest picture is more encouraging than the trough period: gross profit and operating income recovered meaningfully, and net income rebounded from unusually weak levels.
The broad pattern is a classic commodity cycle. Sales and profits rose dramatically when fertilizer prices spiked, then compressed as pricing cooled, and have since started to recover. What matters for long-term analysis is that Yara remained profitable at the operating level through a difficult normalization period and has now rebuilt earnings and cash generation.
Key Figures
| Metric | Value | Sector ⓘ |
|---|---|---|
| Date | Oct 24, 2026 | |
| Context | ||
| Sector | Basic Materials | |
| Industry | Agricultural Inputs | |
| Market Cap ⓘ | $12.47B | |
| Beta ⓘ | 0.26 | |
Value (Cheapness) | ||
| P/E Ratio ⓘ | 8.15 | 16.92 |
| P/B Ratio ⓘ | 1.39 | 1.66 |
| FCF Yield ⓘ | 7.23% | 5.83% |
| Dividend Yield ⓘ | 4.70% | 2.07% |
| EBIT / EV ⓘ | 14.61% | 6.38% |
| PEG ⓘ | 2.62 | |
Growth (Business expansion) | ||
| Revenue Growth ⓘ | 8.10% | 11.25% |
| RPS Growth (5Y CAGR) ⓘ | -1.33% | 4.49% |
| EPS Growth (5Y CAGR) ⓘ | -26.79% | -15.24% |
| BVPS Growth (5Y CAGR) ⓘ | 5.42% | 5.49% |
| Margin Growth (5Y Trend) ⓘ | 7.73% | -1.54% |
| FCF Growth (5Y CAGR) ⓘ | 12.49% | 0.37% |
| DPS Growth (5Y CAGR) ⓘ | -43.01% | 5.91% |
Quality (Business durability) | ||
| ROIC (Latest) ⓘ | N/A | 9.59% |
| ROA (Latest) ⓘ | 8.90% | 4.92% |
| ROIC (5Y Median) ⓘ | 3.99% | 7.91% |
| ROA (5Y Median) ⓘ | 2.65% | 3.92% |
| Net Debt / EBIT (Latest) ⓘ | 1.36 | 1.36 |
| Net Debt / EBIT (5Y Median) ⓘ | 4.51 | 1.69 |
| Net Debt / EBITDA (Latest) ⓘ | 0.90 | 0.93 |
| Net Debt / Assets ⓘ | 17.52% | 13.69% |
| EBITDA / Interest ⓘ | 12.90 | 12.38 |
| Operating Margin (Latest) ⓘ | 13.55% | 13.24% |
| Operating Margin (5Y Median) ⓘ | 5.31% | 11.82% |
| Debt to Equity (Latest) ⓘ | 41.85% | 40.30% |
| Profit Margin (Latest) ⓘ | 9.26% | 6.38% |
| Free Cash Flow (Latest) ⓘ | $901.34M | |
Momentum (Price trend) | ||
| 3Y Return ⓘ | +46.68% | +73.47% |
| 12M Return (excl. last month) ⓘ | +42.34% | +27.59% |
| 6M Return ⓘ | -12.14% | -4.02% |
| Price vs. 200-Day MA ⓘ | +31.55% | -0.65% |
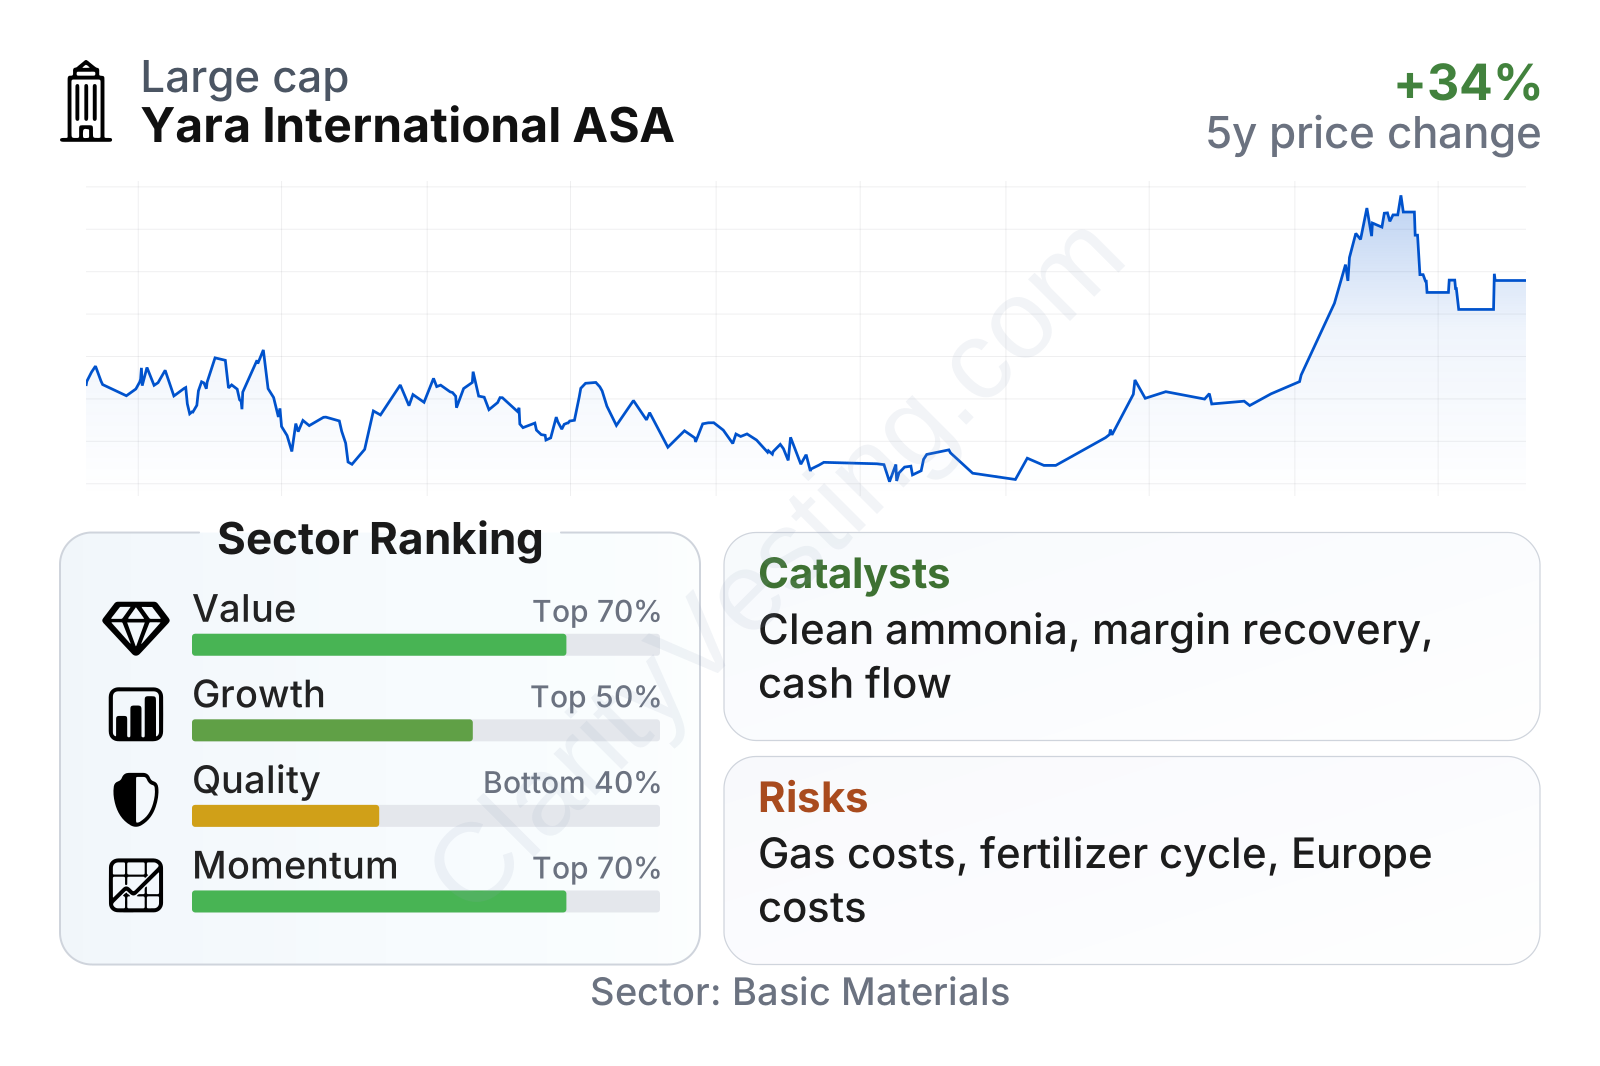
Yara is a large global agricultural inputs company with a relatively low share price volatility, reflected in a beta well below 1. On valuation, several metrics look cheaper than the sector median, including earnings, book value, cash flow yield, and EBIT relative to enterprise value. The dividend yield is also noticeably above the sector median. The weaker area is growth: recent year-over-year revenue growth has turned positive again, but the longer five-year record remains soft because results were pulled down by the post-2022 fertilizer downturn. Quality is mixed rather than poor: current profitability and interest coverage are solid, but long-term returns on capital have been less impressive than many peers because of the industry’s cyclicality.
Growth
Yara operates in a sector with durable structural demand. Fertilizers are tied to global food consumption, crop yield needs, and limited arable land. That does not mean smooth growth every year, but it does support long-term relevance. As populations grow and farming efficiency becomes more important, crop nutrition remains a necessary input rather than an optional purchase.
Yara’s strategy also makes sense for the next phase of the industry. Management has been focused on improving asset efficiency, reducing costs, expanding premium and specialty offerings, and building lower-carbon ammonia and fertilizer capabilities. This last point could become increasingly important. Ammonia is both a fertilizer input and a potential energy-transition product, giving Yara exposure to decarbonization themes in shipping, industry, and cleaner production methods.
The recent revenue trend suggests the business is in recovery rather than in a straight-line expansion. Growth was exceptionally strong in 2021 and 2022, turned negative through much of 2023 and 2024 as fertilizer prices came down, and has returned to positive territory more recently. That pattern is important: current growth is not purely volume-driven expansion, but it does indicate the company is moving away from the weakest point of the cycle.
Cash generation has improved as well. Free cash flow has been volatile, which is normal for a fertilizer producer facing swings in pricing, input costs, and working capital. Still, the latest trailing twelve-month level is comfortably above $1 billion, and the five-year cash flow growth record is stronger than the sector median. For a cyclical materials business, that is one of the more constructive signals in the current setup.
A notable catalyst is Yara’s push into clean ammonia and lower-carbon crop nutrition. The company has announced and advanced multiple projects and partnerships in this area, using its existing ammonia expertise and infrastructure as a base. If low-carbon ammonia adoption expands in shipping fuel, power, or industrial uses, Yara already has industrial logic, customer relationships, and technical capabilities that many agricultural-input peers do not.
Another constructive point is the company’s digital and precision agriculture effort through agronomic tools and farm management solutions. This is still not the core of revenue, but it can deepen customer relationships and support premium products rather than leaving Yara exposed only to commodity fertilizer pricing.
Risks
This article is for informational purposes only and does not constitute financial advice. Some content is AI-generated. See Disclaimer


