Stock Analysis · Yamaha Motor Co. Ltd (YMHAY)
Overview
Yamaha Motor Co. Ltd is a Japanese manufacturer of motorcycles, marine products, recreational vehicles, and small industrial equipment. Although it is often associated most strongly with motorcycles, the company is more diversified than that image suggests. Its businesses reach consumer transportation, leisure, outdoor recreation, and selected industrial uses. The group operates globally, with meaningful exposure to Asia, North America, Europe, and emerging markets.
The company’s revenue base is led by land mobility products, especially motorcycles and related parts, followed by marine and recreational categories. Based on recent annual reporting, the mix is approximately structured as follows:
- Land Mobility: about 63% of revenue. This includes motorcycles, scooters, electrically power-assisted bicycles, parts, and related mobility products. This is the company’s largest earnings engine and its broadest global franchise.
- Marine: about 24% of revenue. This segment includes outboard motors, personal watercraft, boats, and marine accessories. It is one of Yamaha Motor’s most important profit contributors because branded marine equipment can carry stronger pricing power.
- Robotics / Smart Machinery: about 6% of revenue. This covers surface mounters, industrial robots, semiconductor-related equipment, and factory automation products.
- SPV / Recreational / Other Products: about 7% of revenue. This includes recreational off-highway vehicles, golf cars, generators, snowmobiles in some markets, and various smaller businesses.
This mix matters for long-term analysis. Yamaha Motor is not a pure auto company despite being classified in a vehicle-related industry bucket. Its economics are shaped more by powersports, marine leisure, and small mobility than by passenger cars. That gives it a different demand profile from traditional automakers, with stronger brand effects in enthusiast categories but also greater sensitivity to consumer confidence and dealer inventory cycles.
The business flow over recent years shows revenue still trending upward, but with pressure further down the income statement. Gross profit expanded from 2022 to 2025, yet operating income and especially net income became much more volatile, suggesting that higher selling costs, mix changes, and other expenses have absorbed a larger share of sales. That pattern is important because it means scale alone has not recently translated into consistently stronger profitability.
Key Figures
| Metric | Value | Sector ⓘ |
|---|---|---|
| Date | Nov 11, 2026 | |
| Context | ||
| Sector | Consumer Cyclical | |
| Industry | Auto Manufacturers | |
| Market Cap ⓘ | $11.11B | |
| Beta ⓘ | 0.53 | |
Value (Cheapness) | ||
| P/E Ratio ⓘ | 6.12 | 17.68 |
| P/B Ratio ⓘ | N/A | 2.77 |
| FCF Yield ⓘ | 7.81% | 7.34% |
| Dividend Yield ⓘ | 1.95% | 2.54% |
| EBIT / EV ⓘ | 10.19% | 7.09% |
| PEG ⓘ | N/A | |
Growth (Business expansion) | ||
| Revenue Growth ⓘ | 13.40% | 5.10% |
| RPS Growth (5Y CAGR) ⓘ | 12.12% | 8.97% |
| EPS Growth (5Y CAGR) ⓘ | -5.11% | -12.24% |
| BVPS Growth (5Y CAGR) ⓘ | 7.56% | 5.63% |
| Margin Growth (5Y Trend) ⓘ | -5.98% | -0.17% |
| FCF Growth (5Y CAGR) ⓘ | -22.74% | 5.89% |
| DPS Growth (5Y CAGR) ⓘ | 9.38% | 10.17% |
Quality (Business durability) | ||
| ROIC (Latest) ⓘ | 8.17% | 11.42% |
| ROA (Latest) ⓘ | 5.08% | 5.57% |
| ROIC (5Y Median) ⓘ | N/A | 10.52% |
| ROA (5Y Median) ⓘ | 6.90% | 5.37% |
| Net Debt / EBIT (Latest) ⓘ | 2.35 | 2.04 |
| Net Debt / EBIT (5Y Median) ⓘ | 1.70 | 2.24 |
| Net Debt / EBITDA (Latest) ⓘ | 1.64 | 1.44 |
| Net Debt / Assets ⓘ | 18.04% | 21.02% |
| EBITDA / Interest ⓘ | 23.90 | 9.63 |
| Operating Margin (Latest) ⓘ | 7.73% | 9.14% |
| Operating Margin (5Y Median) ⓘ | 10.00% | 9.64% |
| Debt to Equity (Latest) ⓘ | 82.29% | 71.37% |
| Profit Margin (Latest) ⓘ | 5.15% | 5.35% |
| Free Cash Flow (Latest) ⓘ | $867.50M | |
Momentum (Price trend) | ||
| 3Y Return ⓘ | +18.16% | +21.42% |
| 12M Return (excl. last month) ⓘ | +71.44% | 0.00% |
| 6M Return ⓘ | +62.21% | +1.94% |
| Price vs. 200-Day MA ⓘ | +29.75% | +1.50% |
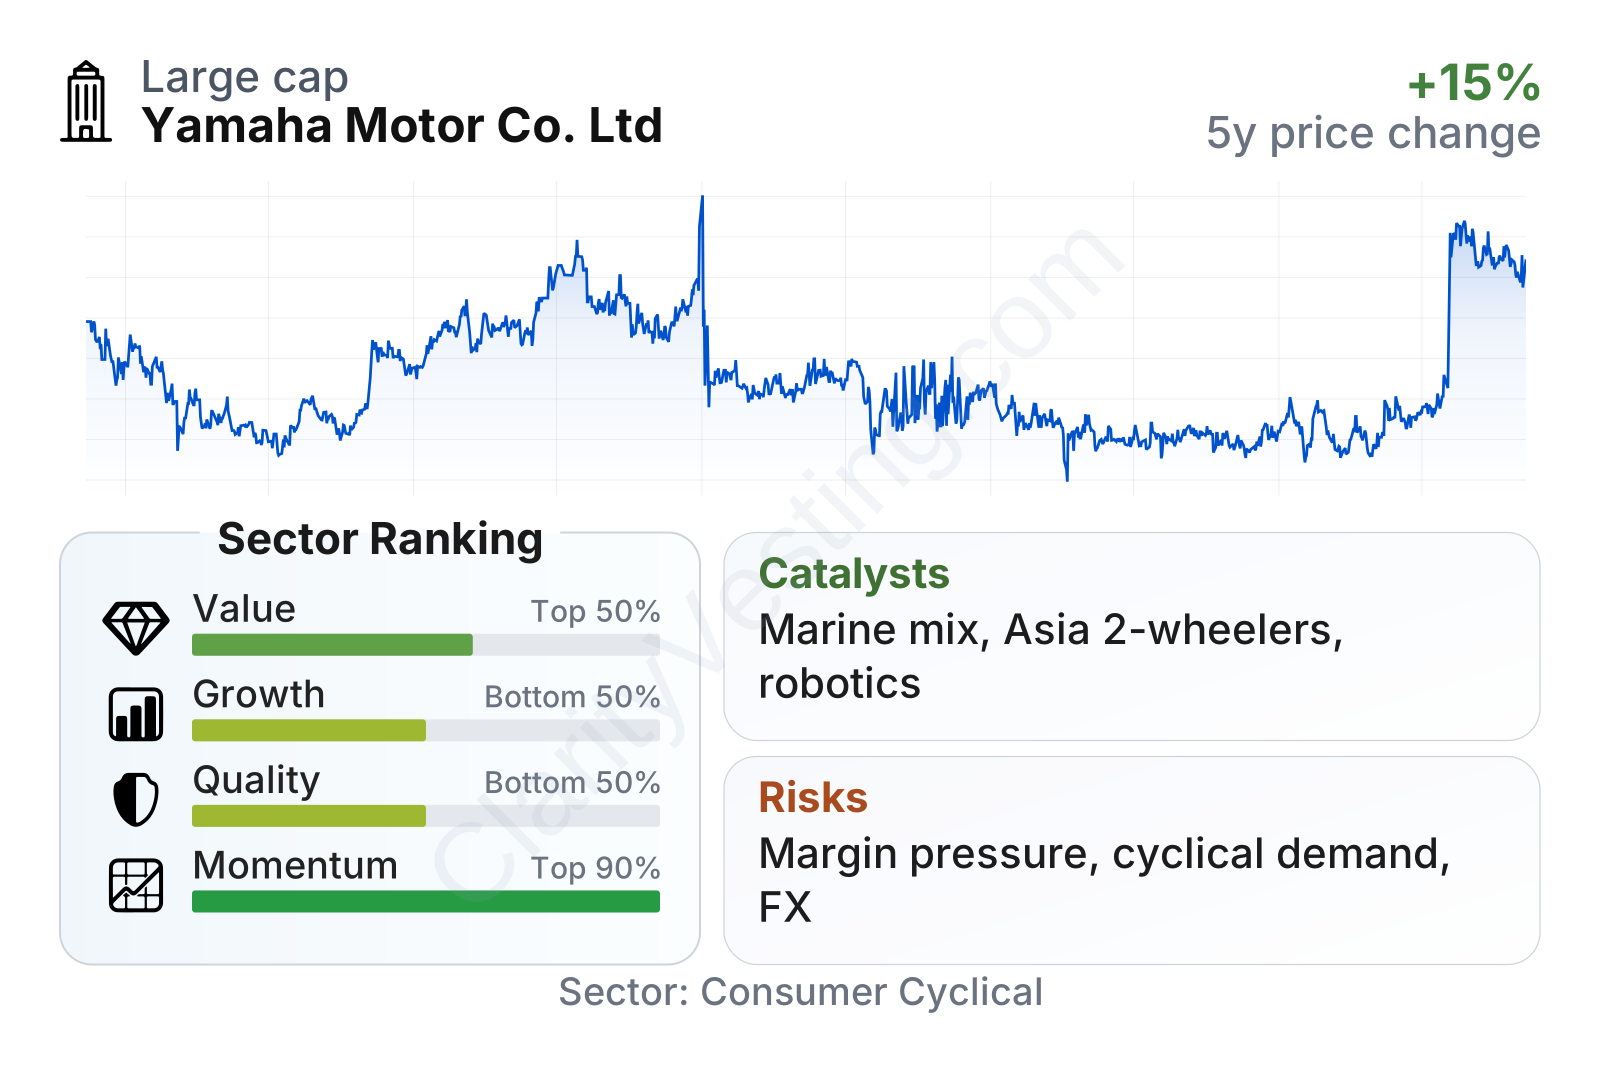
Yamaha Motor sits in the mid-to-large range among global consumer cyclical names, with a stock that has shown relatively low volatility versus the broader market. The valuation profile stands out: earnings multiples are well below the sector median, while cash-flow-based measures also look solid rather than stretched. At the same time, the company’s quality and growth scores are less impressive than the headline valuation suggests. Profitability is currently below many peers, and margin pressure has weighed on returns. In other words, the stock appears inexpensive on current earnings and enterprise-value measures, but that discount likely reflects the market’s caution about the durability of recent profits rather than simple neglect.
The share price trend has also changed noticeably. After a long weak stretch, momentum turned sharply positive in 2026, with the stock rising well above its longer-term average. That rebound signals improved sentiment, but it also means the market has already started to recognize some recovery potential.
Growth
Yamaha Motor operates in several markets that still offer long-term expansion, although not all of them are high-growth sectors. Motorcycles and scooters can grow with urbanization and affordable mobility demand, especially in Southeast Asia, India, and other emerging regions. Marine products benefit from premium leisure spending and replacement demand, while robotics and factory automation offer exposure to a more technology-driven industrial opportunity. This combination gives the company a useful mix: a large installed base in mature product categories and a smaller, potentially higher-upside industrial automation business.
The company’s strategy broadly makes sense for future growth because it is not relying on a single theme. It is working across premium motorcycles, marine systems, electrified small mobility, and automated equipment. Electrification is particularly relevant in scooters, e-bikes, and small urban transport, where Yamaha Motor has a more natural position than in full-scale electric cars. In marine, continued product upgrades and high-value accessories can support revenue per customer even in slower unit environments.
Revenue growth has been uneven but recently improved again, with year-over-year growth moving back into double digits in the latest periods after a softer stretch in 2025. That suggests the company still has the ability to recover demand and push sales higher when market conditions normalize. Over a five-year view, revenue per share growth has also outpaced the sector median, which points to a business that has expanded its commercial footprint even if earnings conversion has lagged.
Cash generation is another part of the growth picture. Free cash flow was negative in parts of 2023 and 2024, then turned positive again and improved into 2026. That recovery matters because it gives Yamaha Motor more flexibility to fund product development, maintain dividends, and manage cyclical downturns. A business in a cyclical industry does not need perfectly smooth cash flow, but a return to positive free cash flow is an important sign that the operating base is stabilizing.
A meaningful catalyst is the company’s exposure to Asian two-wheel mobility and to marine premiumization. In many densely populated markets, motorcycles and scooters remain one of the most practical and affordable forms of transportation. Meanwhile, the marine segment can benefit from customers trading up to higher-value engines and systems. Another catalyst is robotics and industrial equipment: it is still a smaller piece of sales, but if automation demand strengthens, it could become a more important profit source over time because it gives Yamaha Motor exposure beyond consumer discretionary spending.
Risks
This article is for informational purposes only and does not constitute financial advice. Some content is AI-generated. See Disclaimer