Stock Analysis · Yanlord Land Group Limited (YLDGF)
Overview
Yanlord Land Group Limited is a Singapore-listed property developer focused mainly on mainland China, with additional activities in investment properties, property management, and hotel operations. The company is known for residential and mixed-use projects in higher-tier Chinese cities, especially in the Yangtze River Delta and other economically stronger urban clusters. Its business model is still centered on acquiring land, developing projects, and recognizing revenue when homes and commercial units are delivered.
The main sources of revenue are still heavily tied to property development. Based on recent annual disclosures, the mix is broadly as follows:
- Property development: approximately 85% to 95% of revenue in most recent years. This includes sales of residential units, serviced apartments, commercial space, and mixed-use developments.
- Property investment and leasing: approximately 3% to 8%. This covers recurring rental income from offices, retail space, and other completed investment properties.
- Property management, hotels, and other services: generally approximately 1% to 5%. This includes management fees, hospitality-related income, and smaller ancillary activities.
That concentration matters: Yanlord is not a diversified real estate platform in the same way as a large global landlord or asset manager. It is primarily a developer, which means earnings, cash flow timing, and market sentiment can move sharply with China’s residential property cycle.
Over the past several years, the business has remained sizable in revenue terms, but profitability has weakened materially. Revenue stayed large through 2024, yet gross profit and operating income compressed sharply, showing that project completions alone are not enough if pricing, impairments, or cost pressures erode margins. A partial rebound appears in 2025, but at a much lower revenue base than earlier years.
The overall flow of the business shows a clear deterioration from the strong profit levels of 2021 to losses in 2023 and 2024, followed by a modest return to profit in 2025. The key issue is not only sales volume, but also how much profit remains after construction costs, financing costs, taxes, and write-down pressure.
Key Figures
| Metric | Value | Sector ⓘ |
|---|---|---|
| Date | Oct 17, 2026 | |
| Context | ||
| Sector | Real Estate | |
| Industry | Real Estate - Development | |
| Market Cap ⓘ | $1.01B | |
| Beta ⓘ | 0.67 | |
Value (Cheapness) | ||
| P/E Ratio ⓘ | N/A | 17.38 |
| P/B Ratio ⓘ | 0.03 | 0.85 |
| FCF Yield ⓘ | 57.85% | 7.38% |
| Dividend Yield ⓘ | 10.48% | 4.85% |
| EBIT / EV ⓘ | N/A | 3.78% |
| PEG ⓘ | N/A | |
Growth (Business expansion) | ||
| Revenue Growth ⓘ | -33.30% | 5.30% |
| RPS Growth (5Y CAGR) ⓘ | -19.73% | 6.02% |
| EPS Growth (5Y CAGR) ⓘ | 83.03% | -11.37% |
| BVPS Growth (5Y CAGR) ⓘ | -5.25% | 0.45% |
| Margin Growth (5Y Trend) ⓘ | -7.27% | -0.22% |
| FCF Growth (5Y CAGR) ⓘ | -17.71% | 5.40% |
| DPS Growth (5Y CAGR) ⓘ | -0.56% | 5.02% |
Quality (Business durability) | ||
| ROIC (Latest) ⓘ | N/A | 5.69% |
| ROE (Latest) ⓘ | 1.04% | 7.56% |
| ROA (Latest) ⓘ | 0.31% | 2.85% |
| ROIC (5Y Median) ⓘ | 1.09% | 4.22% |
| ROE (5Y Median) ⓘ | 1.06% | 6.03% |
| ROA (5Y Median) ⓘ | 0.25% | 2.44% |
| Net Debt / EBIT (Latest) ⓘ | 3.12 | 7.59 |
| Net Debt / EBIT (5Y Median) ⓘ | 3.92 | 8.40 |
| Net Debt / EBITDA (Latest) ⓘ | 2.85 | 5.27 |
| Net Debt / Assets ⓘ | 14.95% | 37.76% |
| EBITDA / Interest ⓘ | 3.97 | 4.10 |
| Operating Margin (Latest) ⓘ | 17.34% | 35.29% |
| Operating Margin (5Y Median) ⓘ | 17.96% | 37.31% |
| Debt to Equity (Latest) ⓘ | 59.98% | 88.87% |
| Profit Margin (Latest) ⓘ | -2.32% | 19.61% |
| Free Cash Flow (Latest) ⓘ | $586.39M | |
Momentum (Price trend) | ||
| 3Y Return ⓘ | -39.10% | +30.75% |
| 12M Return (excl. last month) ⓘ | +1.53% | +4.36% |
| 6M Return ⓘ | +1.53% | -2.52% |
| Price vs. 200-Day MA ⓘ | +0.75% | -2.34% |
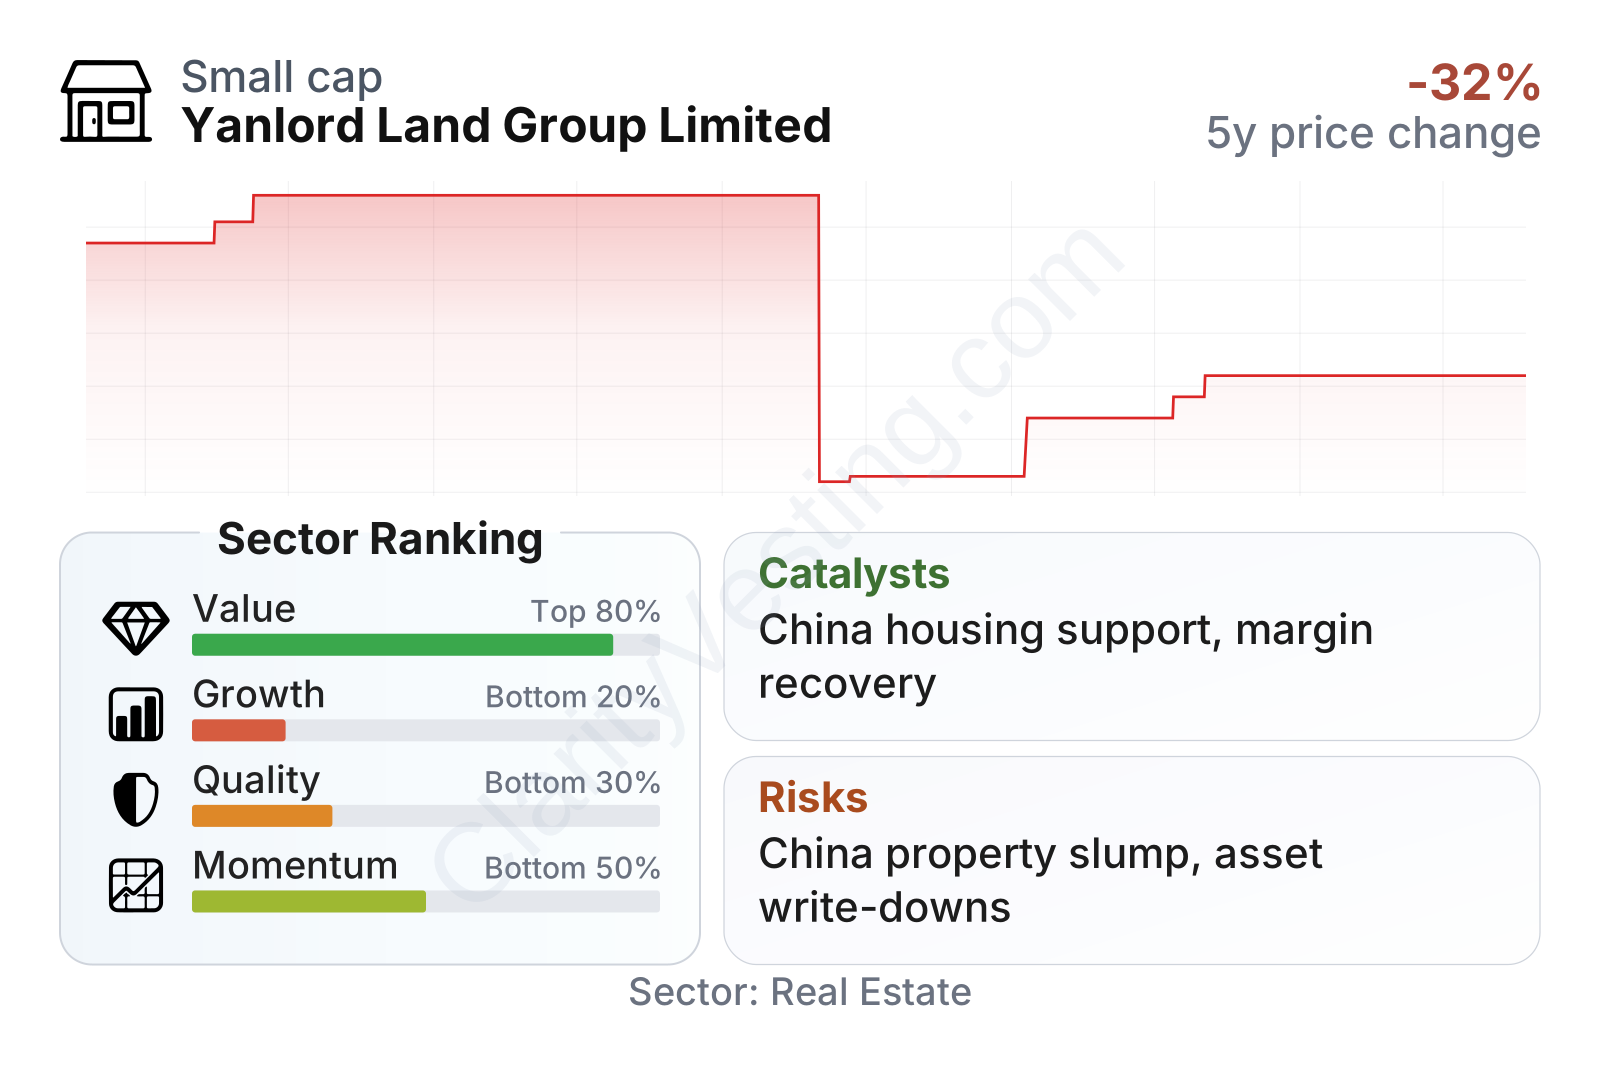
Yanlord screens as very cheap on asset-based and cash-flow-based measures, with a price-to-book ratio near zero compared with the real estate sector median and a free cash flow yield well above most peers. Dividend yield has also been notably above the sector median. However, the same table shows why the market applies such a deep discount: growth ranks in the bottom tier of the sector, profitability is weak, margins have deteriorated, and returns on equity and assets are far below typical peers. Balance-sheet leverage looks more controlled than much of the sector, which is a meaningful positive, but operational quality remains soft.
The share price history reflects that tension. The stock has lost substantial ground over the last three years, though it has shown some stabilization more recently. In other words, the market appears to recognize the company’s asset base and cash generation, but it is still cautious about the durability of earnings and the outlook for Chinese property development.
Growth
Yanlord operates in a sector that still has long-term economic importance in China, but it is no longer a straightforward growth industry. Residential property demand is being reshaped by slower population growth, lower household confidence, tighter financing conditions, and a broader shift away from the debt-fueled expansion that once defined Chinese developers. That means future growth is likely to depend less on rapid national housing expansion and more on whether a developer has the right city exposure, disciplined land buying, and enough financial strength to survive long downturns.
Yanlord’s strategy remains logical within that setting. The company has historically focused on wealthier urban areas and higher-quality developments rather than competing purely on scale. That positioning can be helpful because stronger cities tend to have deeper demand, better income profiles, and more policy support than weaker local markets. If China’s housing market recovery remains selective, premium projects in core locations should fare better than mass-market inventory in oversupplied cities.
The long-term revenue-per-share trend has been uneven rather than steadily compounding. There was a strong spike in 2023, followed by a clear decline through 2025, which fits the pattern of a developer whose reported sales depend heavily on project completion timing and market conditions. This makes growth less predictable than in recurring-revenue businesses.
The dividend record also points to a more cautious phase. Payments have edged down rather than rising over time, suggesting management has been balancing shareholder distributions against the need to protect liquidity in a stressed property market. For a developer in this environment, preserving financial flexibility is often more important than maintaining an aggressive payout path.
Potential catalysts do exist. A broader stabilization in China’s housing market, policy support for home purchases, lower financing costs, and better buyer confidence could all help Yanlord convert inventory and improve margins. In addition, because the company’s valuation is so far below book value, any sustained evidence that asset values are holding up and cash generation remains solid could improve market perception. The most important company-specific opportunity is a continued recovery from the 2024 loss profile toward more normal project profitability in 2025 and beyond.
Risks
This article is for informational purposes only and does not constitute financial advice. Some content is AI-generated. See Disclaimer


