Stock Analysis · Evernorth Holdings Inc (XRPN)
Overview
Evernorth Holdings Inc appears to be a small financial services company operating in the capital markets area. Based on the available public financial information, the business does not currently show a conventional operating revenue base in the way investors usually see with established brokers, asset managers, exchanges, or lenders. The latest available figures point to a company whose reported earnings are influenced more by balance-sheet items, investment-related activity, or non-operating elements than by recurring operating sales.
That distinction matters for a long-term analysis. A typical capital markets company usually earns money from management fees, trading-related income, advisory work, interest spread, or servicing revenue. In Evernorth’s case, the latest financial breakdown suggests that reported operating revenue was negligible while expenses remained meaningful, especially general and administrative costs. Net income was still positive, which implies earnings may have come from sources outside core operations or from accounting items that do not yet reflect a mature, scaled business model.
Because the company’s current disclosures available here do not provide a clear recurring revenue mix, the revenue picture is best described cautiously:
- Recurring operating revenue: not clearly established in the latest available breakdown.
- Non-operating or investment-related contributions: appear to have played a significant role in reported net income.
- Expenses: selling, general, and administrative costs represented the main visible operating outflow in the latest breakdown.
This makes Evernorth less straightforward to analyze than a traditional financial stock. The key issue is not just how much it earns, but whether those earnings are durable, repeatable, and tied to a business franchise that can expand over time.
The latest operating flow suggests a weak connection between accounting profit and core operating activity. That usually means long-term evaluation depends heavily on whether management can convert the company into a more consistent revenue-generating platform.
Key Figures
| Metric | Value | Sector ⓘ |
|---|---|---|
| Date | Oct 31, 2026 | |
| Context | ||
| Sector | Financial Services | |
| Industry | Capital Markets | |
| Market Cap ⓘ | $978.68M | |
| Beta ⓘ | N/A | |
Value (Cheapness) | ||
| P/E Ratio ⓘ | 147.10 | 12.20 |
| P/B Ratio ⓘ | N/A | 1.26 |
| FCF Yield ⓘ | -0.04% | 9.87% |
| Dividend Yield ⓘ | N/A | 2.87% |
| EBIT / EV ⓘ | N/A | 8.17% |
| PEG ⓘ | N/A | |
Growth (Business expansion) | ||
| Revenue Growth ⓘ | N/A | 8.40% |
| RPS Growth (5Y CAGR) ⓘ | N/A | 12.31% |
| EPS Growth (5Y CAGR) ⓘ | N/A | -4.03% |
| BVPS Growth (5Y CAGR) ⓘ | N/A | 4.96% |
| Margin Growth (5Y Trend) ⓘ | N/A | -4.14% |
| FCF Growth (5Y CAGR) ⓘ | N/A | 4.70% |
| DPS Growth (5Y CAGR) ⓘ | N/A | 8.85% |
Quality (Business durability) | ||
| ROIC (Latest) ⓘ | N/A | 9.35% |
| ROE (Latest) ⓘ | N/A | 13.95% |
| ROA (Latest) ⓘ | 1.29% | 1.57% |
| ROIC (5Y Median) ⓘ | N/A | 7.78% |
| ROE (5Y Median) ⓘ | N/A | 12.12% |
| ROA (5Y Median) ⓘ | N/A | 1.28% |
| Net Debt / EBIT (Latest) ⓘ | N/A | 0.99 |
| Net Debt / EBIT (5Y Median) ⓘ | N/A | 0.73 |
| Net Debt / EBITDA (Latest) ⓘ | N/A | 0.79 |
| Operating Margin (Latest) ⓘ | N/A | 22.61% |
| Operating Margin (5Y Median) ⓘ | N/A | 24.52% |
| Debt to Equity (Latest) ⓘ | N/A | 58.76% |
| Profit Margin (Latest) ⓘ | N/A | 26.18% |
| Free Cash Flow (Latest) ⓘ | -$373.20K | |
Momentum (Price trend) | ||
| 3Y Return ⓘ | N/A | +95.34% |
| 12M Return (excl. last month) ⓘ | +23.21% | +16.22% |
| 6M Return ⓘ | +42.26% | +7.41% |
| Price vs. 200-Day MA ⓘ | +29.47% | +5.48% |
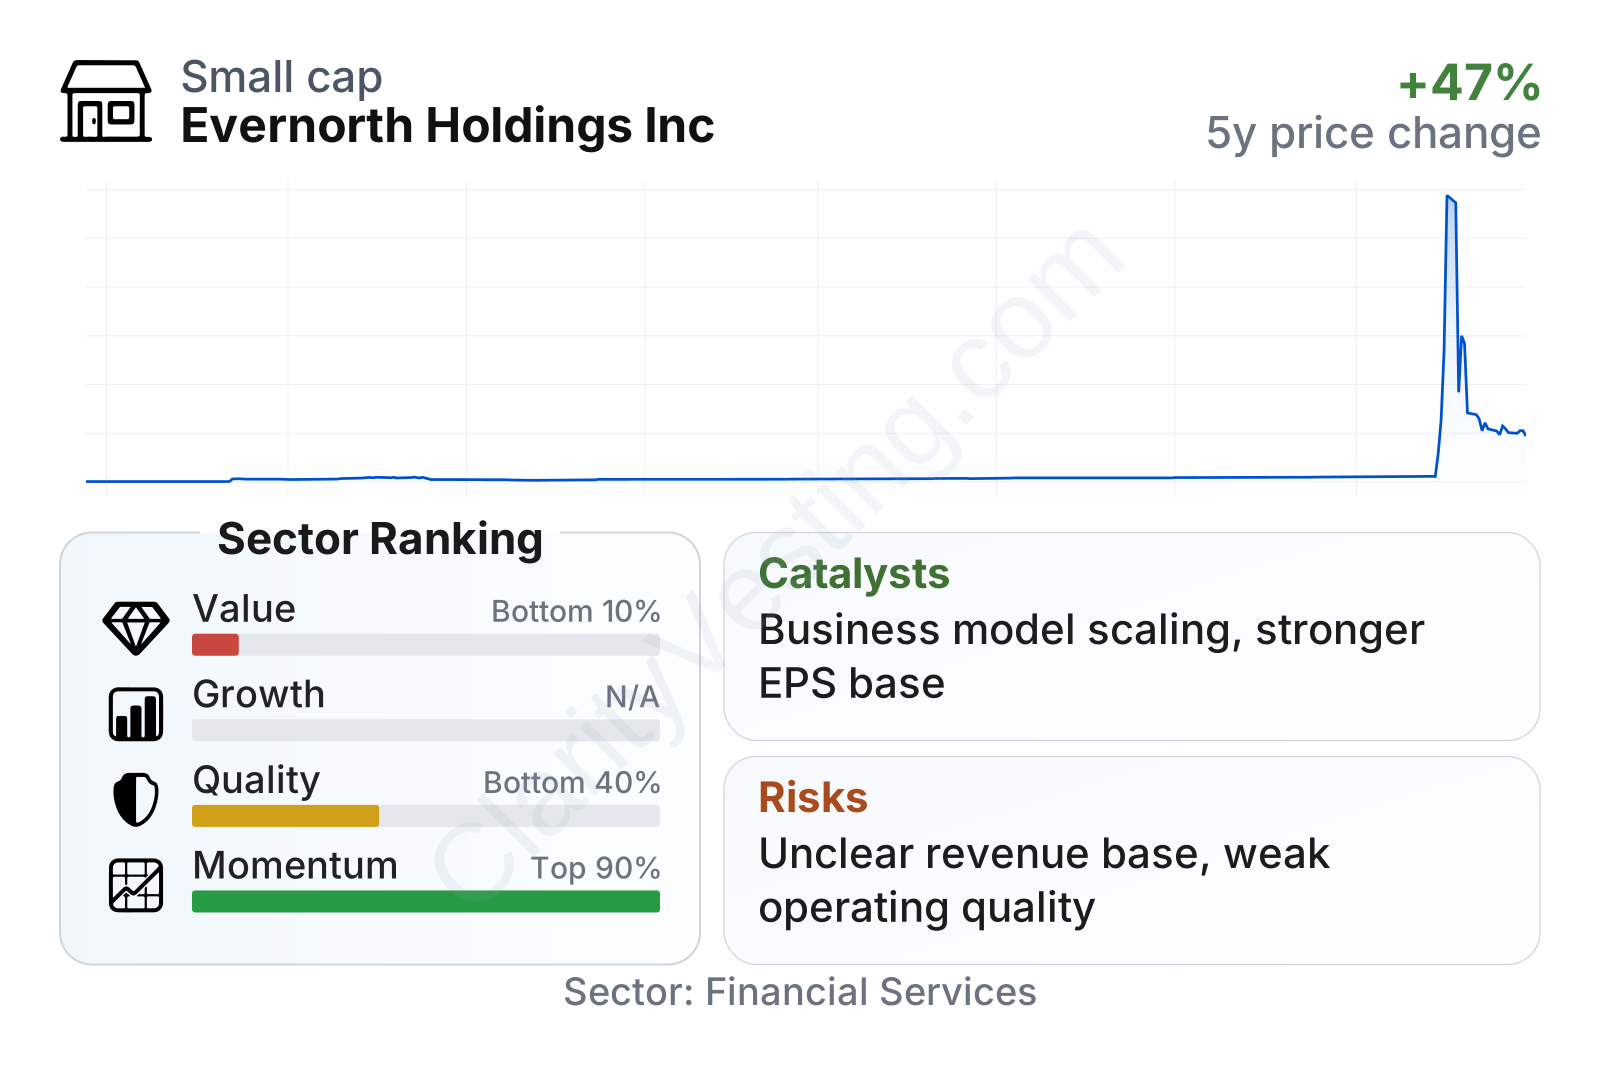
The market value remains in small-cap territory, which can create room for re-rating if execution improves, but it also tends to come with less business stability and thinner margins for error. The stock’s recent price trend has been strong relative to much of the sector, with gains over the last 6 to 12 months clearly ahead of the median financial stock. By contrast, the fundamental factor profile is much less favorable: valuation screens poorly because earnings are thin relative to price, quality sits below sector norms, and growth does not yet show a clear operating acceleration.
The most notable contradiction is that momentum is strong while value and operating quality are weak. That often happens when the market begins pricing in a possible business transition, asset realization, or future strategic development before it fully appears in reported fundamentals.
Growth
The broader capital markets sector can be attractive over long periods because it benefits from rising financial activity, asset values, and investor participation. However, that tailwind only helps if a company has a defined product, client base, or scalable platform. For Evernorth, the central growth question is still business clarity. Recent numbers do not show measurable year-over-year revenue growth, which suggests the company is still in an early or transitional phase rather than in a proven expansion cycle.
Even so, there are a few elements that could support future growth if execution improves. First, the company has maintained positive earnings per share in the latest periods, which indicates it is not purely pre-revenue in an accounting sense. Second, the share price has climbed steadily over the past year, often a sign that the market expects some favorable development. Third, as a smaller company, even modest progress in building recurring revenue, controlling costs, or improving asset productivity could have an outsized effect on future results.
Earnings per share have been positive but broadly flat, which points to stability rather than acceleration. For a long-term growth profile, that is not enough on its own. What would matter more is evidence that profits are increasingly supported by operating revenue rather than by one-off or less predictable items.
No major public-domain 2026 catalyst stands out from the information available here in the way one might see with a large acquisition, transformative product launch, or major regulatory approval. As a result, the growth case is presently more about potential business normalization and better monetization than about a clearly visible step-change event.
Risks
This article is for informational purposes only and does not constitute financial advice. Some content is AI-generated. See Disclaimer


