Stock Analysis · Expro Group Holdings NV (XPRO)
Overview
Expro Group Holdings NV is an oilfield services company. It provides specialized equipment and technical services used during well construction, well completion, well intervention, production optimization, and subsea operations. In simple terms, Expro helps energy producers drill wells, prepare them to start producing, keep them operating efficiently, and manage technically difficult offshore and deepwater work.
The business serves both onshore and offshore customers, but it is especially exposed to offshore and subsea activity, where projects are more complex and service intensity is usually higher. The company operates across major energy regions, including North and Latin America, Europe and Sub-Saharan Africa, the Middle East and North Africa, and Asia Pacific. This geographic spread reduces dependence on a single country, but it does not remove exposure to the global oil and gas investment cycle.
Based on company reporting, Expro’s revenue mix is organized primarily by geography rather than by product line. Approximate revenue contributions have recently been distributed as follows:
- North and Latin America: about 35% to 40% of revenue. This region includes offshore and onshore well services, intervention, and production-related activity.
- Europe and Sub-Saharan Africa: about 25% to 30% of revenue. This is an important area for offshore and mature-field work, including North Sea and African operations.
- Middle East and North Africa: about 20% to 25% of revenue. This market includes national oil company contracts and longer-duration development activity.
- Asia Pacific: about 10% to 15% of revenue. This region includes offshore developments and subsea-related work.
From a service perspective, Expro is strongest in higher-specification work such as well construction support, completion services, intervention and integrity services, and subsea well access. These are not commodity-like offerings in the same way as basic pressure pumping or land drilling services, which can support better customer retention when technical reliability matters.
Financially, the company has gone through a clear recovery. Revenue expanded strongly from 2021 through 2024, operating profitability improved sharply, and net income turned positive in 2024 and remained positive in 2025. The latest pattern, however, shows that growth has cooled and margins have narrowed again, which matters because service companies can see earnings swing quickly when customer spending slows.
The long-term pattern is encouraging: revenue climbed from roughly $0.8 billion in 2021 to above $1.7 billion in 2024 before easing in 2025, while operating income moved from a deep loss to a solid profit. That shows a real turnaround in scale and cost structure, even if the latest year suggests the recovery has entered a less favorable phase.
Key Figures
| Metric | Value | Sector ⓘ |
|---|---|---|
| Date | Oct 03, 2026 | |
| Context | ||
| Sector | Energy | |
| Industry | Oil & Gas Equipment & Services | |
| Market Cap ⓘ | $1.79B | |
| Beta ⓘ | 1.00 | |
Value (Cheapness) | ||
| P/E Ratio ⓘ | 88.72 | 14.47 |
| P/B Ratio ⓘ | 1.20 | 1.70 |
| FCF Yield ⓘ | 9.07% | 8.66% |
| Dividend Yield ⓘ | N/A | 3.77% |
| EBIT / EV ⓘ | 3.74% | 7.46% |
| PEG ⓘ | 0.72 | |
Growth (Business expansion) | ||
| Revenue Growth ⓘ | -7.00% | 27.35% |
| RPS Growth (5Y CAGR) ⓘ | 7.87% | 6.75% |
| EPS Growth (5Y CAGR) ⓘ | -3.09% | -15.45% |
| BVPS Growth (5Y CAGR) ⓘ | -4.77% | 5.85% |
| Margin Growth (5Y Trend) ⓘ | 19.20% | 0.75% |
| FCF Growth (5Y CAGR) ⓘ | N/A | 3.62% |
| DPS Growth (5Y CAGR) ⓘ | 16.95% | 16.85% |
Quality (Business durability) | ||
| ROIC (Latest) ⓘ | 1.50% | 11.33% |
| ROA (Latest) ⓘ | 0.91% | 6.03% |
| ROIC (5Y Median) ⓘ | 1.08% | 10.16% |
| ROA (5Y Median) ⓘ | -1.04% | 5.34% |
| Net Debt / EBIT (Latest) ⓘ | N/A | 1.62 |
| Net Debt / EBIT (5Y Median) ⓘ | -0.77 | 1.91 |
| Net Debt / EBITDA (Latest) ⓘ | N/A | 1.06 |
| Net Debt / Assets ⓘ | N/A | 17.29% |
| EBITDA / Interest ⓘ | 23.99 | 9.64 |
| Operating Margin (Latest) ⓘ | 4.40% | 16.32% |
| Operating Margin (5Y Median) ⓘ | 1.67% | 19.53% |
| Debt to Equity (Latest) ⓘ | N/A | 54.41% |
| Profit Margin (Latest) ⓘ | 1.33% | 8.79% |
| Free Cash Flow (Latest) ⓘ | $162.74M | |
Momentum (Price trend) | ||
| 3Y Return ⓘ | -32.11% | +62.93% |
| 12M Return (excl. last month) ⓘ | +45.31% | +44.83% |
| 6M Return ⓘ | -9.42% | -1.62% |
| Price vs. 200-Day MA ⓘ | -2.74% | +5.18% |
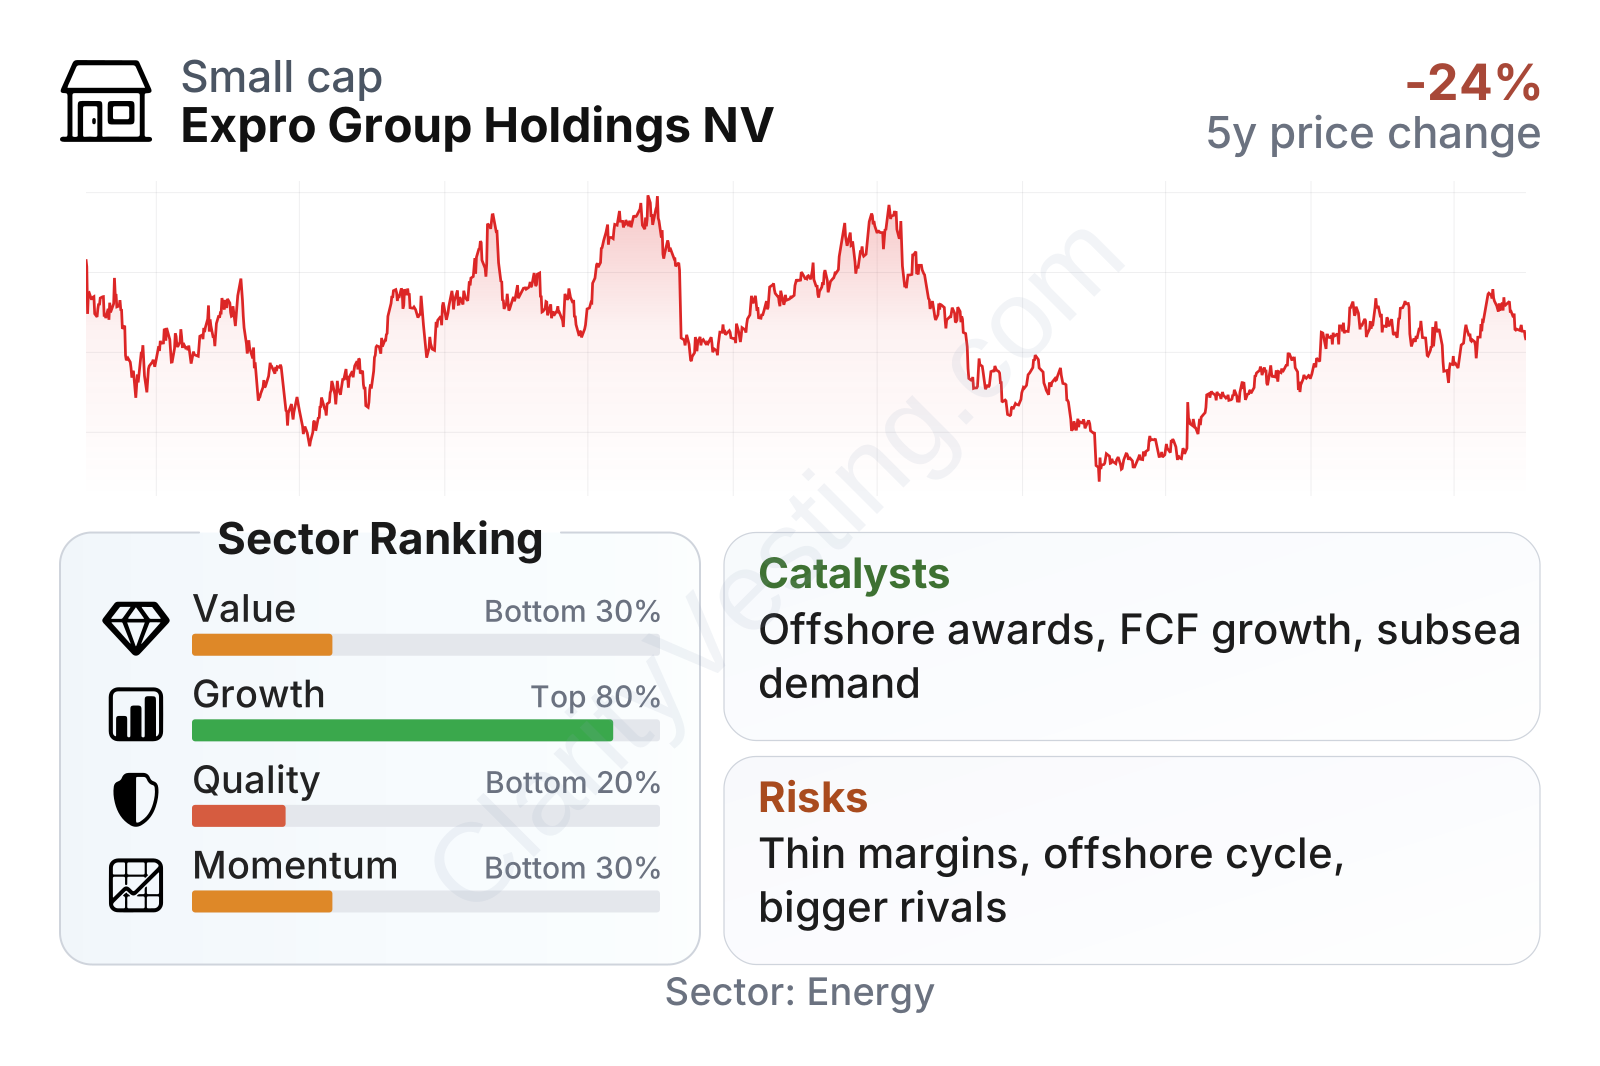
Expro is a mid-sized energy services company with share-price volatility close to the broader market rather than extreme levels. The overall factor picture is mixed. Growth metrics still look better than many industry peers on a multiyear basis, but quality metrics are weak because returns on capital and margins remain below sector norms. Valuation metrics also send conflicting signals: the price-to-book ratio is not demanding, free cash flow yield is respectable, but the earnings multiple looks elevated because profits are still relatively thin.
The stock’s longer-term trading history has also been uneven. After strong periods in 2023 and parts of 2024, the shares went through a steep drawdown in 2025 before partially recovering in 2026. That pattern matches the company’s profile: operational progress is real, but confidence can change quickly when revenue momentum fades.
Growth
Expro operates in a part of the energy market that still has meaningful long-cycle support. Offshore, deepwater, and subsea projects remain important because large producers are prioritizing fields with long reserve lives and attractive production economics. These developments require specialized services, and that plays into Expro’s capabilities better than a business focused mainly on short-cycle U.S. land activity.
The company’s strategy also makes industrial sense. Management has emphasized higher-value services, international exposure, offshore work, and technology-led offerings rather than trying to compete on sheer scale in the broadest oilfield services categories. For a smaller company, that is a logical path: niche technical work can create better margins and stronger customer relationships than a more commoditized service mix.
The main issue is timing. Revenue growth was very strong through 2022, 2023, and much of 2024, but the most recent trend has turned negative, with year-over-year declines in the latest quarters. That does not automatically break the long-term case, yet it shows the company is now moving from expansion to a period where contract timing, customer spending discipline, and project execution matter more than broad market recovery.
One of the more constructive signs is cash generation. Free cash flow has improved dramatically from negative territory to clearly positive levels over the last few years. That matters because cash flow is harder to dress up than accounting profit. It suggests Expro’s operating recovery has become more tangible, even though accounting margins are still modest.
Recent company updates have also pointed to continued contract wins and activity in offshore and international markets, particularly where well access, intervention, and subsea expertise are needed. Those are useful catalysts because they support backlog visibility and reinforce the company’s technical positioning. The broad industry backdrop is also helpful: many national oil companies and large offshore operators continue to invest in production capacity, maintenance, and recovery enhancement rather than relying only on frontier exploration.
A further growth angle is production optimization and well life extension. In a world where operators want more output from existing assets, service providers that can improve well performance and reduce downtime can remain relevant even when industry spending is not booming. Expro’s portfolio gives it exposure to that theme, not just to new-well activity.
Risks
This article is for informational purposes only and does not constitute financial advice. Some content is AI-generated. See Disclaimer