Stock Analysis · Exxon Mobil Corp (XOM)
Overview
Exxon Mobil is one of the world’s largest integrated energy companies. In simple terms, it operates across most of the oil and gas value chain: it explores for crude oil and natural gas, produces them, moves and trades them, turns them into fuels and chemicals, and sells refined products into global markets. That broad structure matters because it gives the company more than one way to earn money. When crude prices are strong, production tends to do well. When refining margins improve, downstream operations can help balance weaker commodity markets.
Its business is generally organized around three large engines: upstream production, energy products, and chemicals and specialty products. Based on recent annual reporting, the largest share of revenue still comes from refined products and trading activity, while a very large share of profit often comes from upstream production because extraction can be highly profitable when oil and gas prices are favorable.
Main revenue sources can be summarized as follows:
- Energy Products: about 75% to 80% of revenue. This includes refined petroleum products such as gasoline, diesel, jet fuel, lubricants, base stocks, and associated trading and marketing activity.
- Chemicals and Specialty Products: about 15% to 20% of revenue. This includes commodity petrochemicals, performance products, and specialty materials used in packaging, industrial applications, and consumer goods.
- Upstream: about 5% to 10% of revenue. This includes crude oil, natural gas, natural gas liquids, and related sales. This segment’s revenue share is lower than its economic importance because raw production has a different pricing and reporting profile than large-scale product sales.
Geographically, Exxon Mobil is highly diversified. It operates in the United States and internationally, with major positions in the Permian Basin, Guyana, liquefied natural gas, refining, and global chemicals. The company has also been investing in lower-emission businesses such as carbon capture, hydrogen, and lithium, though these remain much smaller than its core hydrocarbon operations.
The multi-year profit flow shows a business that remains enormous in scale but has moved off the 2022 earnings peak. Revenue and operating income eased after that exceptional year, yet profitability stayed substantial, helped by disciplined costs and low interest expense.
Key Figures
| Metric | Value | Sector ⓘ |
|---|---|---|
| Date | Oct 24, 2026 | |
| Context | ||
| Sector | Energy | |
| Industry | Oil & Gas Integrated | |
| Market Cap ⓘ | $731.34B | |
| Beta ⓘ | 0.21 | |
Value (Cheapness) | ||
| P/E Ratio ⓘ | 22.89 | 15.40 |
| P/B Ratio ⓘ | 2.94 | 1.71 |
| FCF Yield ⓘ | 4.18% | 8.24% |
| Dividend Yield ⓘ | 2.29% | 3.52% |
| EBIT / EV ⓘ | 6.07% | 7.45% |
| PEG ⓘ | 1.38 | |
Growth (Business expansion) | ||
| Revenue Growth ⓘ | 44.10% | 26.85% |
| RPS Growth (5Y CAGR) ⓘ | 3.84% | 6.78% |
| EPS Growth (5Y CAGR) ⓘ | -25.43% | -14.41% |
| BVPS Growth (5Y CAGR) ⓘ | 11.59% | 6.08% |
| Margin Growth (5Y Trend) ⓘ | 1.30% | 0.55% |
| FCF Growth (5Y CAGR) ⓘ | -10.04% | 2.75% |
| DPS Growth (5Y CAGR) ⓘ | 3.48% | 16.79% |
Quality (Business durability) | ||
| ROIC (Latest) ⓘ | 10.55% | 11.30% |
| ROA (Latest) ⓘ | 7.13% | 6.00% |
| ROIC (5Y Median) ⓘ | 13.15% | 10.35% |
| ROA (5Y Median) ⓘ | 8.12% | 5.46% |
| Net Debt / EBIT (Latest) ⓘ | 0.75 | 1.64 |
| Net Debt / EBIT (5Y Median) ⓘ | 0.37 | 1.82 |
| Net Debt / EBITDA (Latest) ⓘ | 0.44 | 1.08 |
| Net Debt / Assets ⓘ | 6.84% | 17.29% |
| EBITDA / Interest ⓘ | 88.78 | 9.53 |
| Operating Margin (Latest) ⓘ | 11.68% | 16.21% |
| Operating Margin (5Y Median) ⓘ | 14.70% | 20.55% |
| Debt to Equity (Latest) ⓘ | 16.33% | 52.27% |
| Profit Margin (Latest) ⓘ | 9.07% | 8.79% |
| Free Cash Flow (Latest) ⓘ | $30.55B | |
Momentum (Price trend) | ||
| 3Y Return ⓘ | +76.93% | +68.93% |
| 12M Return (excl. last month) ⓘ | +44.38% | +42.90% |
| 6M Return ⓘ | +21.64% | +9.18% |
| Price vs. 200-Day MA ⓘ | +17.74% | +9.87% |
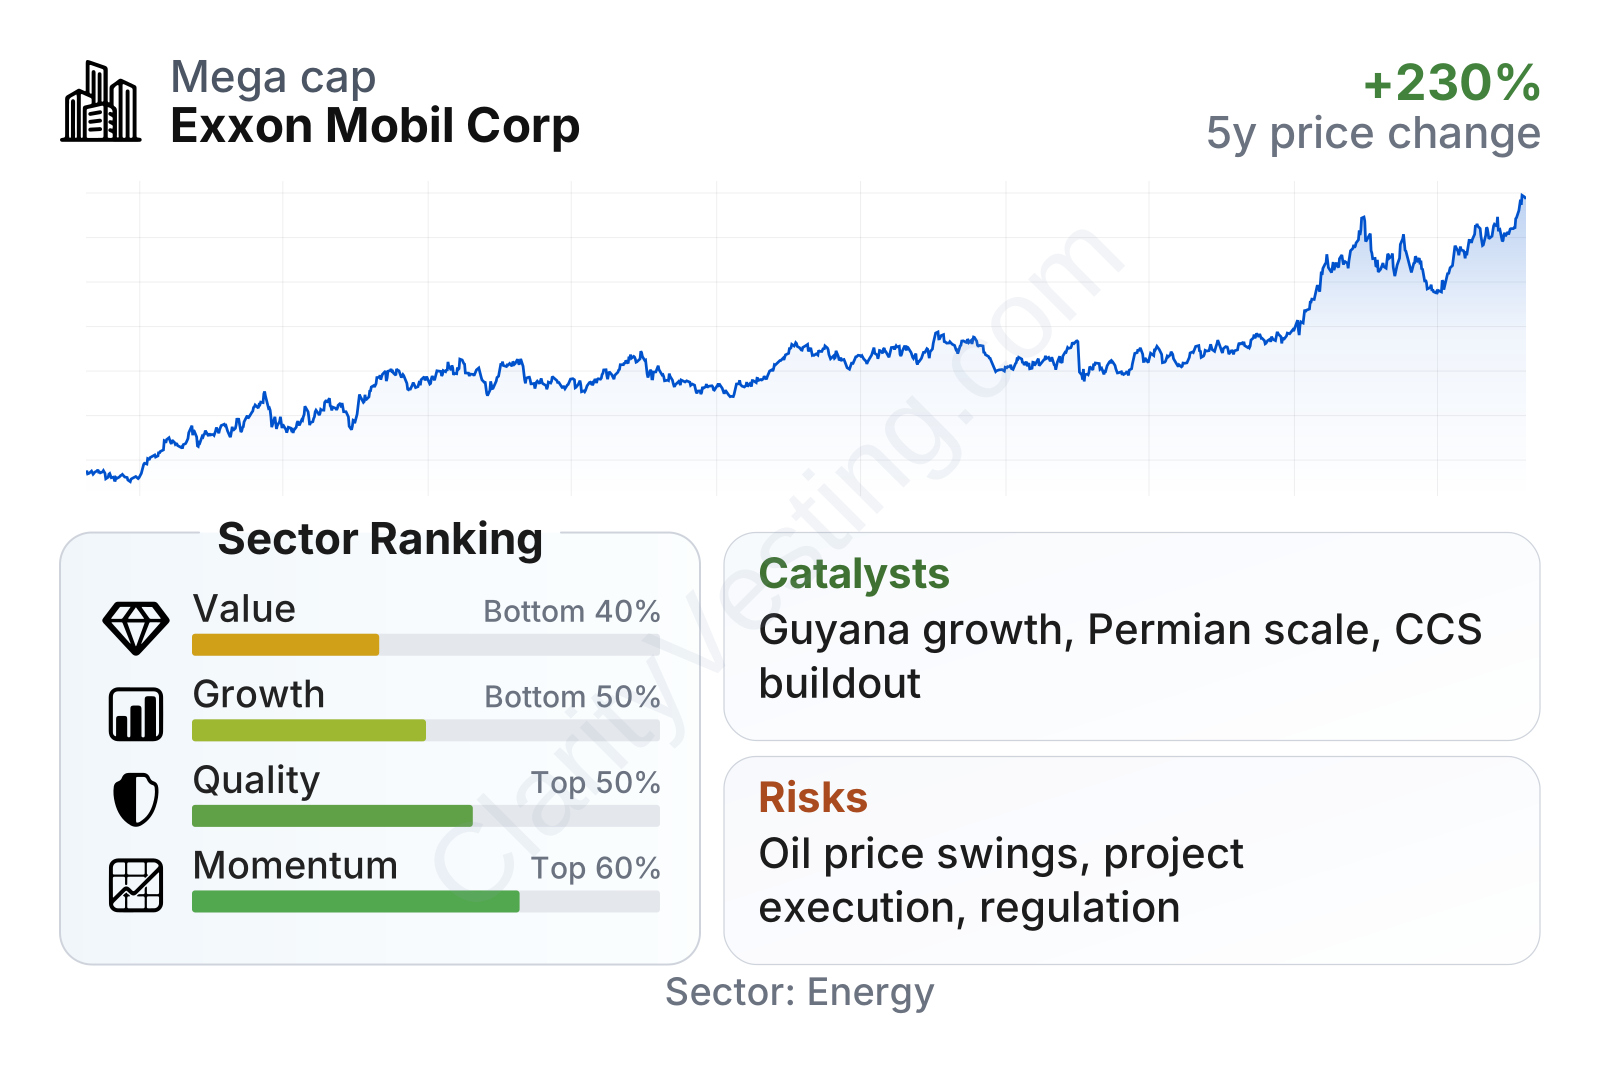
Exxon Mobil stands out for balance-sheet strength and overall business quality more than for cheap headline valuation. Compared with the broader energy group, leverage is clearly lower, returns on assets are solid, and interest coverage is exceptionally strong. The weaker areas are value and long-term growth, where the stock trades above sector medians while multi-year revenue and cash flow growth have been less impressive than many peers.
The stock chart also reflects how much market sentiment toward Exxon Mobil can change with oil prices, refining margins, and major project milestones. Over the last several years, the move has been strong in absolute terms, but the path has not been smooth.
Growth
Exxon Mobil operates in a sector that is mature, but still strategically important. Oil and gas demand is not a high-growth theme in the same way as software or semiconductors, yet global energy consumption remains very large and difficult to replace quickly. That means growth for Exxon Mobil is less about entering a new industry and more about producing more barrels at lower cost, improving refining and chemicals performance, and adding adjacent businesses that can matter over time.
A central part of that strategy is its focus on advantaged assets. The two most important examples are Guyana and the Permian Basin. Guyana has become one of the most significant new oil provinces in the world, with low-cost offshore production and a long runway for additional development. In the Permian, Exxon Mobil has scale, infrastructure, and operational depth, especially after its major shale acquisition activity. These assets can support production growth even if the broader industry grows slowly.
Recent revenue growth has been volatile, which is normal for a commodity-linked company. The latest year-over-year rebound is strong, but the longer pattern shows how revenue can swing from sharp increases to declines as oil, gas, and product prices move. For long-term analysis, that makes it more useful to focus on asset quality and cash generation than on any single quarter’s sales trend.
Free cash flow remains large in absolute dollars, even though it is below the post-2022 highs. That still gives Exxon Mobil room to fund capital spending, maintain dividends, and preserve financial flexibility. The main question is not whether the company can generate cash, but how durable that cash generation remains if commodity prices weaken.
Another growth angle is the company’s lower-emissions platform. Exxon Mobil has been building businesses in carbon capture and storage, hydrogen, and lithium. These are not yet large enough to reshape the income statement, but they could become meaningful if regulation, industrial decarbonization spending, and customer demand develop in Exxon’s favor. Carbon capture is especially relevant because it fits the company’s subsurface engineering and large-project capabilities.
Recent company updates have also emphasized cost savings, integration benefits from acquisitions, and new project start-ups. Those are meaningful catalysts because in this industry, a low-cost barrel or a more efficient refinery often matters more than simple volume growth. Exxon Mobil’s future expansion is therefore tied less to a broad energy boom and more to disciplined execution on a handful of world-class assets.
Risks
This article is for informational purposes only and does not constitute financial advice. Some content is AI-generated. See Disclaimer


