Stock Analysis · Xencor Inc (XNCR)
Overview
Xencor is a biotechnology company focused on designing engineered antibodies. In simple terms, antibodies are proteins that can be used as medicines to help the immune system recognize or attack disease. Xencor’s specialty is modifying the structure of antibodies to improve how long they stay in the body, how strongly they activate the immune system, or how precisely they target cancer and immune-related diseases.
The company’s business model is a mix of internal drug development and partnering. It advances some medicines on its own, especially in oncology and immunology, while also licensing its antibody-engineering technologies to larger pharmaceutical companies. That means Xencor can generate cash from collaboration payments even before it has a fully commercialized product of its own.
Based on recent annual disclosures, revenue is mainly made up of collaboration-related income rather than product sales. Xencor does not yet operate like a mature pharmaceutical company with a broad base of recurring commercial revenue. Its revenue sources can be summarized as follows:
- Collaboration and licensing revenue: the large majority of total revenue, roughly more than 90% in recent years. This typically includes upfront payments, milestone payments, cost-sharing arrangements, and amortization of previously received licensing consideration from partners.
- Contract and research-related revenue: a small portion, generally less than 10%, tied to research support or reimbursable activities under partnerships.
- Product revenue: currently not a meaningful contributor, because Xencor remains primarily a development-stage biotechnology company rather than a large-scale commercial drug seller.
This structure matters for long-term analysis because collaboration revenue can be substantial, but it is often uneven from year to year. Results can swing sharply depending on milestone timing, partner decisions, and clinical progress.
One notable financial pattern is that research spending has remained very high relative to revenue. In several recent years, research and development spending alone has exceeded total revenue, which helps explain why profitability has been inconsistent and mostly negative after 2021.
The business remains centered on funding innovation through partnerships while trying to turn its pipeline into larger future economics.
Key Figures
| Metric | Value | Sector ⓘ |
|---|---|---|
| Date | Oct 17, 2026 | |
| Context | ||
| Sector | Healthcare | |
| Industry | Biotechnology | |
| Market Cap ⓘ | $1.74B | |
| Beta ⓘ | 0.90 | |
Value (Cheapness) | ||
| P/E Ratio ⓘ | N/A | 24.79 |
| P/B Ratio ⓘ | 3.62 | 3.08 |
| FCF Yield ⓘ | -11.98% | 3.15% |
| Dividend Yield ⓘ | N/A | 1.94% |
| EBIT / EV ⓘ | -8.82% | 0.57% |
| PEG ⓘ | N/A | |
Growth (Business expansion) | ||
| Revenue Growth ⓘ | 17.50% | 7.45% |
| RPS Growth (5Y CAGR) ⓘ | -21.91% | 8.61% |
| EPS Growth (5Y CAGR) ⓘ | N/A | -17.81% |
| BVPS Growth (5Y CAGR) ⓘ | -8.33% | 3.72% |
| Margin Growth (5Y Trend) ⓘ | N/A | -0.62% |
| FCF Growth (5Y CAGR) ⓘ | N/A | 1.04% |
| DPS Growth (5Y CAGR) ⓘ | N/A | 6.77% |
Quality (Business durability) | ||
| ROIC (Latest) ⓘ | -15.97% | 3.24% |
| ROA (Latest) ⓘ | -20.50% | 3.01% |
| ROIC (5Y Median) ⓘ | -8.81% | 4.60% |
| ROA (5Y Median) ⓘ | -10.06% | 1.89% |
| Net Debt / EBIT (Latest) ⓘ | N/A | 1.34 |
| Net Debt / EBIT (5Y Median) ⓘ | N/A | 1.84 |
| Net Debt / EBITDA (Latest) ⓘ | N/A | 1.00 |
| Net Debt / Assets ⓘ | 2.83% | 5.45% |
| EBITDA / Interest ⓘ | N/A | 9.64 |
| Operating Margin (Latest) ⓘ | -127.44% | 9.27% |
| Operating Margin (5Y Median) ⓘ | -50.11% | 7.38% |
| Debt to Equity (Latest) ⓘ | 12.96% | 28.58% |
| Profit Margin (Latest) ⓘ | -155.59% | 3.59% |
| Free Cash Flow (Latest) ⓘ | -$208.28M | |
Momentum (Price trend) | ||
| 3Y Return ⓘ | +26.65% | +42.80% |
| 12M Return (excl. last month) ⓘ | +179.74% | +18.50% |
| 6M Return ⓘ | +91.85% | +7.57% |
| Price vs. 200-Day MA ⓘ | +47.46% | +5.12% |
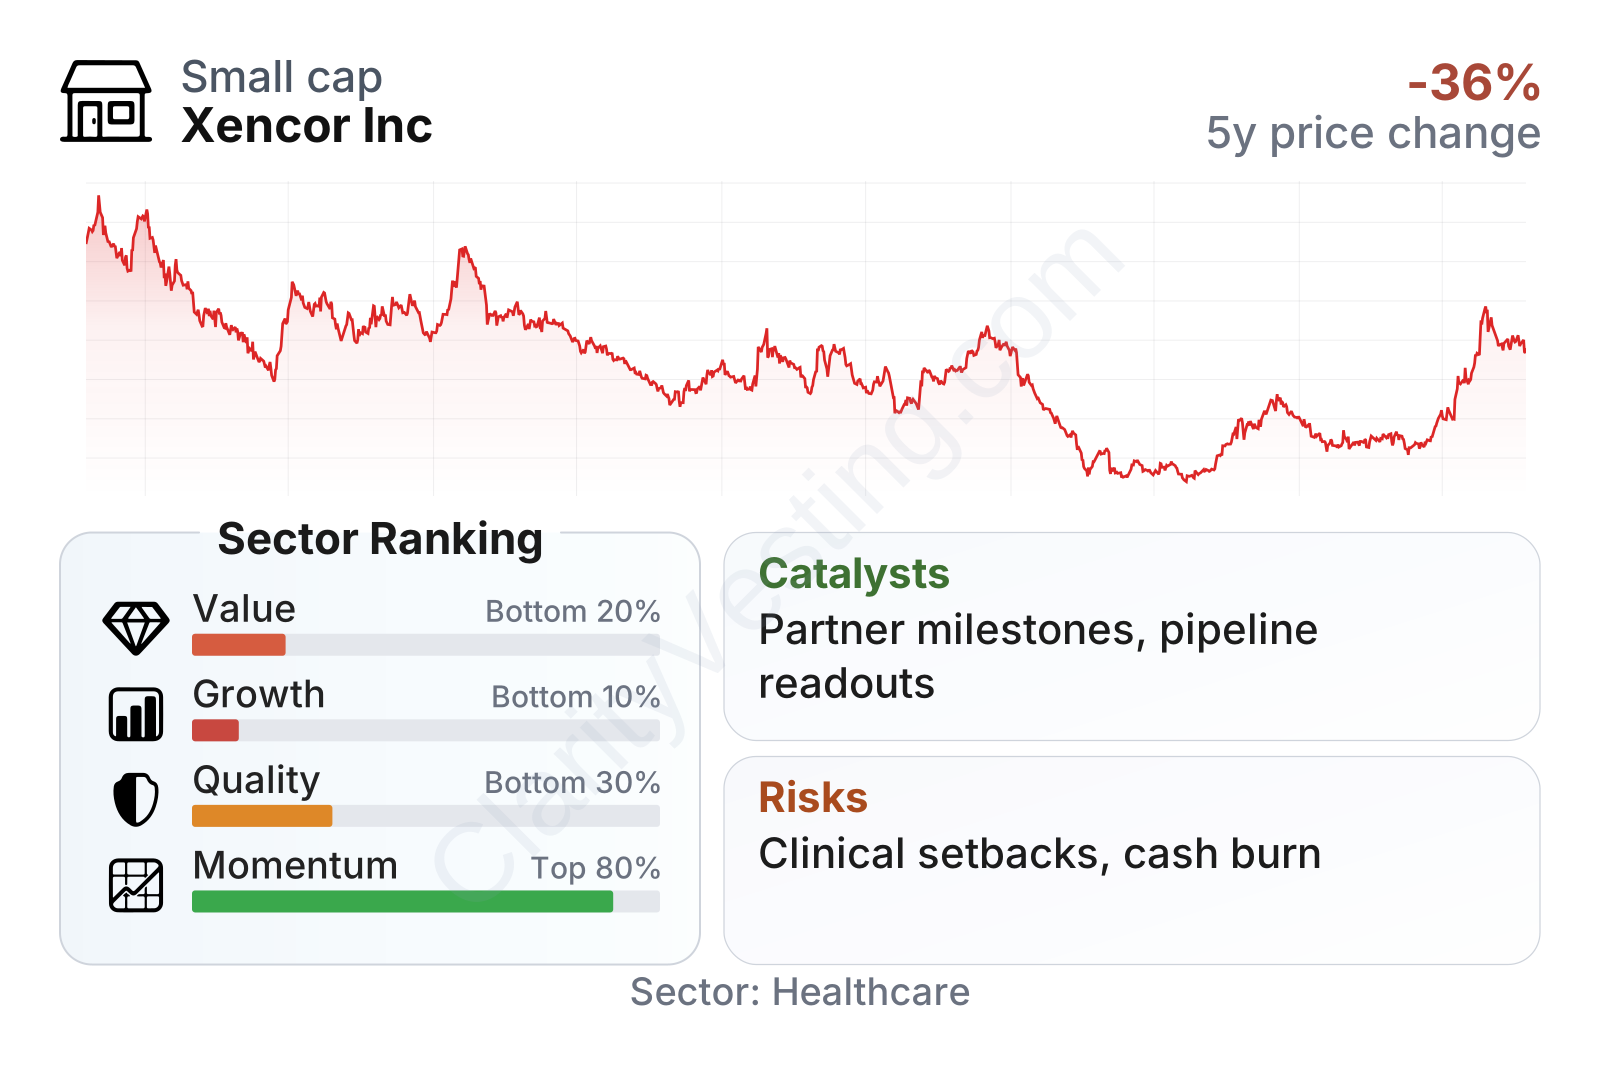
Xencor is a mid-sized biotech company by market value, with a share price history that has been highly volatile. The metrics table points to a mixed profile: recent price momentum has been very strong, but value, quality, and growth rankings remain weak versus the broader healthcare sector. That combination is common in biotech when enthusiasm around pipeline developments improves faster than the underlying income statement.
The balance sheet appears less stretched than many development-stage peers, with debt levels below the sector median and a beta below 1, but profitability and cash generation remain weak. Negative free cash flow, negative returns on capital, and deeply negative margins show that the company is still in the expensive development phase rather than the cash-harvesting phase.
Growth
Biotechnology remains a structurally attractive sector for long-term growth because successful drugs can create large and durable revenue streams, and large pharmaceutical companies continue to rely on external innovation. Xencor operates in a part of biotech that is especially relevant: antibody engineering. Antibody-based medicines are already one of the most important areas in modern drug development, and technologies that improve antibody performance can be valuable both for internal programs and licensing deals.
Xencor’s strategy is logical for this sector. Instead of depending on a single asset, it has built platform technologies and partnered them across multiple programs. That creates several paths to value creation: wholly owned drug candidates, milestone payments from collaborators, and possible royalties if partnered medicines reach the market. In biotech, that is often more resilient than relying on one binary event, even though it does not eliminate risk.
Revenue growth has been uneven, which is normal for a company driven by partnership accounting and milestone timing. Recent year-over-year growth has recovered from the sharp declines seen in earlier periods, but the longer-term picture is still choppy rather than steadily compounding. That makes headline growth less informative than pipeline progress and partnership quality.
Free cash flow has been consistently negative and has deteriorated over the last several years, reflecting continued investment in research. That is not unusual in biotech, but it means future upside depends heavily on pipeline execution and additional non-dilutive funding from partnerships or milestones.
A major current growth catalyst is the company’s pipeline transition after setbacks in some wholly owned programs. Xencor has increasingly emphasized high-value partnered assets and selective internal development. Recent company updates have highlighted progress in oncology candidates and ongoing collaboration opportunities using its XmAb technology platforms. If more partnered programs move into later-stage development, Xencor could capture milestone and royalty economics without having to fund every trial alone.
Another important opportunity comes from the pharmaceutical industry’s continued appetite for antibody-based assets. Large drugmakers frequently license external science rather than invent everything internally. Xencor is positioned to benefit if its technology continues to be seen as a useful way to enhance antibodies for cancer and immune diseases.
Risks
This article is for informational purposes only and does not constitute financial advice. Some content is AI-generated. See Disclaimer


