Stock Analysis · Xenon Pharmaceuticals Inc (XENE)
Overview
Xenon Pharmaceuticals is a clinical-stage biotechnology company focused on developing treatments for neurological disorders. Its research is centered on ion channel medicines, especially therapies designed to control abnormal electrical activity in the brain. In simple terms, Xenon is trying to build new drugs for epilepsy and other conditions affecting the central nervous system, with the most important current programs aimed at seizure disorders and major depressive disorder.
The business is still in the development stage, which means it does not yet have a marketed product generating recurring commercial sales. As a result, revenue is limited and uneven, and it mainly comes from collaboration-related items rather than product sales.
The main revenue sources are currently:
- Collaboration and licensing revenue: historically the dominant source, tied to research partnerships, upfront payments, milestones, or amortization of prior agreements. In some recent periods, this represented nearly 100% of reported revenue because product sales were absent.
- Other revenue: a very small residual category when present, typically linked to agreement-related accounting items rather than a stand-alone operating business.
- Product revenue: 0% at this stage, because Xenon does not yet have an approved product on the market.
What stands out most is the company’s spending profile. Research and development has expanded sharply over the last several years as Xenon advanced its pipeline into larger and more expensive clinical trials. That is typical for a biotech company moving closer to potential late-stage value inflection points, but it also means the business currently runs at a large operating loss and depends on its balance sheet to fund development.
The financial flow shows a company with very limited revenue and rapidly rising research spending. The pattern is clear: Xenon is directing the bulk of its resources toward drug development, while losses have widened as clinical programs have matured.
Key Figures
| Metric | Value | Sector ⓘ |
|---|---|---|
| Date | Oct 24, 2026 | |
| Context | ||
| Sector | Healthcare | |
| Industry | Biotechnology | |
| Market Cap ⓘ | $3.48B | |
| Beta ⓘ | 0.60 | |
Value (Cheapness) | ||
| P/E Ratio ⓘ | N/A | 25.42 |
| P/B Ratio ⓘ | 2.93 | 3.08 |
| FCF Yield ⓘ | -9.72% | 3.12% |
| Dividend Yield ⓘ | N/A | 1.85% |
| EBIT / EV ⓘ | -15.98% | 0.56% |
| PEG ⓘ | -0.06 | |
Growth (Business expansion) | ||
| Revenue Growth ⓘ | -100.00% | 7.50% |
| RPS Growth (5Y CAGR) ⓘ | -31.21% | 8.60% |
| EPS Growth (5Y CAGR) ⓘ | N/A | -17.73% |
| BVPS Growth (5Y CAGR) ⓘ | -12.34% | 3.72% |
| Margin Growth (5Y Trend) ⓘ | N/A | -0.57% |
| FCF Growth (5Y CAGR) ⓘ | N/A | 0.96% |
| DPS Growth (5Y CAGR) ⓘ | N/A | 6.69% |
Quality (Business durability) | ||
| ROIC (Latest) ⓘ | -35.09% | 3.17% |
| ROA (Latest) ⓘ | -42.99% | 2.98% |
| ROIC (5Y Median) ⓘ | -20.24% | 4.56% |
| ROA (5Y Median) ⓘ | -21.22% | 1.87% |
| Net Debt / EBIT (Latest) ⓘ | N/A | 1.34 |
| Net Debt / EBIT (5Y Median) ⓘ | N/A | 1.86 |
| Net Debt / EBITDA (Latest) ⓘ | N/A | 1.00 |
| Net Debt / Assets ⓘ | -8.73% | 5.06% |
| EBITDA / Interest ⓘ | N/A | 9.55 |
| Operating Margin (Latest) ⓘ | N/A | 9.25% |
| Operating Margin (5Y Median) ⓘ | -1368.91% | 7.33% |
| Debt to Equity (Latest) ⓘ | 0.52% | 26.68% |
| Profit Margin (Latest) ⓘ | N/A | 3.34% |
| Free Cash Flow (Latest) ⓘ | -$338.53M | |
Momentum (Price trend) | ||
| 3Y Return ⓘ | +11.62% | +51.61% |
| 12M Return (excl. last month) ⓘ | +4.66% | +19.90% |
| 6M Return ⓘ | -35.57% | +10.10% |
| Price vs. 200-Day MA ⓘ | -30.50% | +6.44% |
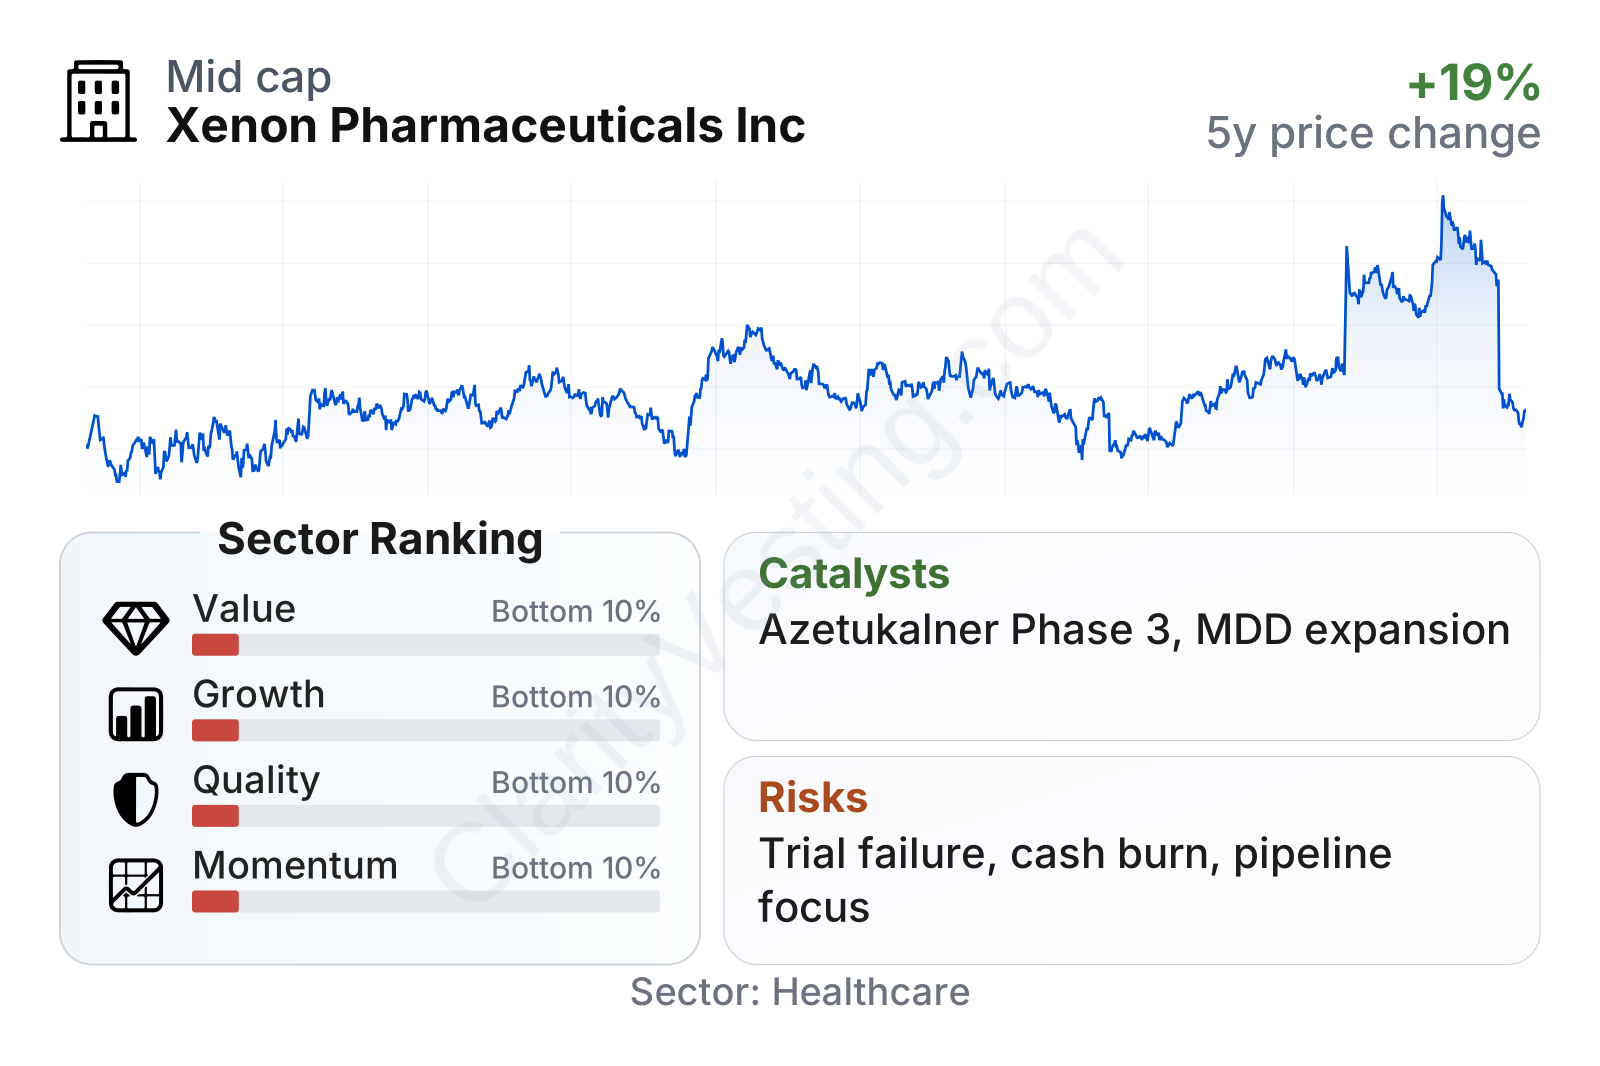
Xenon is a mid-sized biotech company by market value, and the stock has been volatile but has still moved meaningfully higher over the multi-year period shown. The latest factor snapshot is weak on value, quality, and growth versus the healthcare sector median, which is not surprising for a company without product revenue and with heavy clinical spending. One notable offset is the balance sheet: leverage is extremely low, and the stock’s beta is below 1, suggesting its trading pattern has at times been less sensitive than many higher-volatility biotech names.
Growth
Xenon operates in a sector with attractive long-term demand drivers. Neurology remains a large unmet-need market, especially in epilepsy, where many patients do not achieve adequate seizure control with existing medicines or struggle with side effects. Central nervous system drug development is difficult, but successful assets can become commercially significant because these disorders are chronic and often require long-term treatment.
Xenon’s strategy is straightforward and sensible for a clinical-stage biotech: concentrate capital on a narrower set of high-potential neurology programs, generate differentiated clinical data, and move lead assets toward late-stage trials and, eventually, registration. The company’s lead candidate, azetukalner, has become the core of that plan. It is being studied across multiple indications, which matters because one molecule with several possible uses can create more value than a single-indication program if the data hold up.
Recent company updates have reinforced that azetukalner is the main growth catalyst. Xenon has been advancing Phase 3 epilepsy development and has also continued work in major depressive disorder. For a company at this stage, the biggest opportunities usually come from clinical readouts, regulatory progress, and the possibility that a successful late-stage asset could shift the business from a research platform toward a future commercial organization or a larger strategic transaction.
The revenue trend is not a useful measure of underlying business momentum here because Xenon’s reported revenue depends heavily on partnership accounting and milestone timing rather than product demand. Large swings, including periods with little or no revenue, are normal for this type of biotech and say more about deal structure than about the strength of the pipeline.
Cash generation is moving in the opposite direction of growth at this stage: free cash flow remains deeply negative and has become more negative over time. That reflects the company’s deliberate choice to invest heavily in clinical development now in exchange for a chance at much larger future economics if its lead programs succeed.
Risks
This article is for informational purposes only and does not constitute financial advice. Some content is AI-generated. See Disclaimer


