Stock Analysis · Xcel Energy Inc (XEL)
Overview
Xcel Energy is a large regulated utility serving customers across eight U.S. states, with operations centered on electricity and natural gas delivery. Its business is built around generating, transmitting, and distributing power, while also delivering natural gas to homes and businesses. Because most of its operations are regulated, earnings are generally tied less to short-term economic swings and more to approved investments in infrastructure, grid upgrades, and energy generation.
The company’s revenue mix is still dominated by electricity. Based on recent annual reporting, the main sources of revenue are approximately:
- Electric utility revenue: about 83% to 87% — retail electricity sales to residential, commercial, and industrial customers, plus transmission-related revenue and other electric services.
- Natural gas utility revenue: about 13% to 17% — retail natural gas sales, transportation, and related delivery services.
Xcel also has a sizable renewable generation footprint, but investors should note that wind and solar are not usually reported as a standalone top-line revenue category in the same way as electric and gas utility segments. Instead, renewable assets are embedded mainly within the regulated electric business, where they support rate base growth and long-term earnings.
The business profile has become somewhat more profitable over the last several years. Revenue has moved up and down with fuel costs and customer demand, but operating income and net income have trended higher overall, suggesting that margin improvement and regulated investment recovery have helped offset uneven sales.
Over the past few years, revenue has been relatively variable, while operating profit and net income have shown a steadier upward direction. That pattern is typical of a regulated utility that can improve earnings through infrastructure investment even when top-line growth is not especially strong.
Key Figures
| Metric | Value | Sector ⓘ |
|---|---|---|
| Date | Oct 03, 2026 | |
| Context | ||
| Sector | Utilities | |
| Industry | Utilities - Regulated Electric | |
| Market Cap ⓘ | $44.16B | |
| Beta ⓘ | 0.40 | |
Value (Cheapness) | ||
| P/E Ratio ⓘ | 19.37 | 16.80 |
| P/B Ratio ⓘ | 1.84 | 1.48 |
| FCF Yield ⓘ | -17.42% | 0.64% |
| Dividend Yield ⓘ | 3.35% | 3.91% |
| EBIT / EV ⓘ | 4.23% | 5.01% |
| PEG ⓘ | 1.78 | |
Growth (Business expansion) | ||
| Revenue Growth ⓘ | -5.10% | 6.00% |
| RPS Growth (5Y CAGR) ⓘ | 0.03% | 4.14% |
| EPS Growth (5Y CAGR) ⓘ | -13.51% | -11.39% |
| BVPS Growth (5Y CAGR) ⓘ | 8.51% | 4.29% |
| Margin Growth (5Y Trend) ⓘ | 3.80% | 3.55% |
| FCF Growth (5Y CAGR) ⓘ | N/A | -9.10% |
| DPS Growth (5Y CAGR) ⓘ | 5.89% | 4.51% |
Quality (Business durability) | ||
| ROIC (Latest) ⓘ | 6.60% | 6.53% |
| ROA (Latest) ⓘ | 2.69% | 3.19% |
| ROIC (5Y Median) ⓘ | 6.72% | 6.12% |
| ROA (5Y Median) ⓘ | 2.86% | 2.76% |
| Net Debt / EBIT (Latest) ⓘ | 11.00 | 7.15 |
| Net Debt / EBIT (5Y Median) ⓘ | 10.49 | 7.24 |
| Net Debt / EBITDA (Latest) ⓘ | 5.86 | 4.40 |
| Net Debt / Assets ⓘ | 43.95% | 39.16% |
| EBITDA / Interest ⓘ | 4.41 | 4.41 |
| Operating Margin (Latest) ⓘ | 23.84% | 20.93% |
| Operating Margin (5Y Median) ⓘ | 18.51% | 20.18% |
| Debt to Equity (Latest) ⓘ | 167.61% | 140.88% |
| Profit Margin (Latest) ⓘ | 15.28% | 11.32% |
| Free Cash Flow (Latest) ⓘ | -$7.69B | |
Momentum (Price trend) | ||
| 3Y Return ⓘ | +36.28% | +48.75% |
| 12M Return (excl. last month) ⓘ | +7.78% | +11.24% |
| 6M Return ⓘ | -9.89% | -3.69% |
| Price vs. 200-Day MA ⓘ | -8.42% | -1.97% |
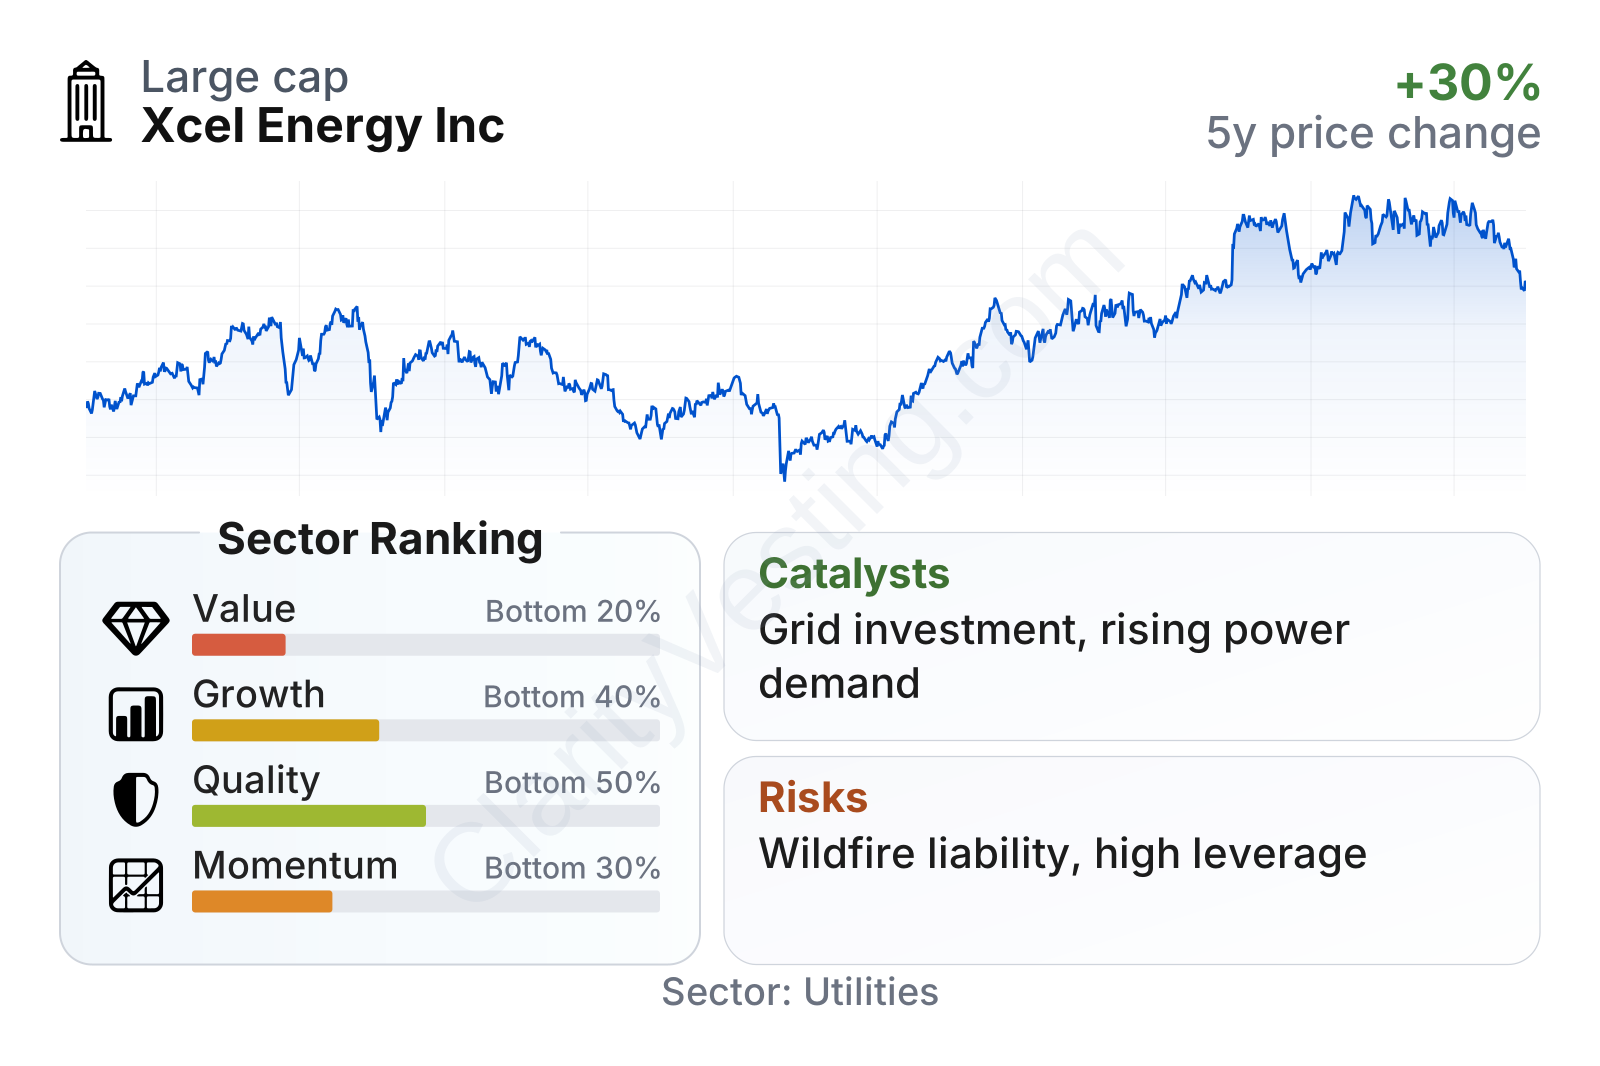
Xcel Energy is a large utility with relatively low share-price volatility, reflected in a beta well below 1. In the broader utility sector, its current profile looks mixed: profitability is solid, leverage is elevated, recent growth measures are weak, and valuation appears richer than the sector median. The stock’s recent momentum has also been softer than many peers after a strong run into late 2025 and early 2026.
Growth
Xcel operates in a sector that is not usually associated with rapid expansion, but it can still grow steadily through approved capital spending. That matters because regulated utilities often increase earnings by building assets that are added to rate base, such as transmission lines, substations, generation facilities, and resilience upgrades. In Xcel’s case, the long-term backdrop remains supportive: rising electricity demand from data centers, manufacturing, building electrification, and the need to modernize the grid all create room for continued investment.
The company’s strategy also fits well with the energy transition. Xcel has been one of the more visible U.S. utilities in renewable deployment and carbon reduction planning, and that can create a multi-year pipeline of projects. In a regulated model, success does not depend on selling solar panels or wind turbines directly; it depends on whether state regulators allow the company to recover spending and earn a return on those assets. That makes execution and regulatory relationships more important than headline demand alone.
Revenue per share has been mostly flat over the last five years, which shows that the growth case is not really about strong top-line acceleration. Instead, the more important point is that the company has continued to expand book value, improve operating margins over time, and raise its dividend at a pace above the sector median. For a utility, that combination can still support a constructive long-term business outlook even when sales growth looks modest.
One area that needs context is cash flow. Free cash flow has been deeply negative and has worsened sharply, but for utilities this often reflects heavy capital investment rather than a sudden collapse in the business. Xcel is spending aggressively on its network and generation portfolio, which can support future earnings if regulators approve recovery. Still, persistent negative free cash flow means growth is relying heavily on external financing, which raises the importance of balance-sheet discipline.
A meaningful recent opportunity is the broader increase in U.S. power demand expectations. Utilities with existing service territories, transmission assets, and renewable development experience are in a stronger position when large customers seek new power supply. Xcel’s footprint in fast-growing regions such as Texas and parts of the Mountain West makes that trend especially relevant.
Risks
This article is for informational purposes only and does not constitute financial advice. Some content is AI-generated. See Disclaimer


