Stock Analysis · Worley Parsons Ltd (WYGPY)
Overview
Worley Parsons Ltd, now commonly branded as Worley, is an engineering, project delivery, and professional services company focused on energy, chemicals, and resources. In simple terms, it helps customers design, build, maintain, and improve large industrial assets such as oil and gas facilities, mining operations, chemical plants, power infrastructure, and lower-carbon energy projects. The company operates globally and earns most of its money from service work rather than from owning commodity-producing assets itself.
That business model matters for long-term analysis. Worley is not mainly taking direct oil-price risk like an exploration company. Instead, its results depend more on customer spending cycles, project awards, execution quality, labor availability, and the mix between traditional hydrocarbon work and newer energy-transition activity.
Based on the company’s reporting structure in recent annual materials, revenue is primarily generated from large end markets rather than from consumer-facing products. The mix can shift by year, but the broad ranking has generally been:
- Energy: approximately 55% to 65% of revenue. This includes upstream and downstream oil and gas, refining, fuels, LNG, power, and increasingly work tied to decarbonization and lower-emission infrastructure.
- Chemicals: approximately 15% to 25% of revenue. This covers petrochemicals, specialty chemicals, fertilizers, and related industrial processing projects.
- Resources: approximately 15% to 25% of revenue. This includes mining, metals, minerals processing, and associated infrastructure.
Within those markets, Worley’s services usually span consulting, engineering design, procurement support, construction and commissioning management, operations support, maintenance, and asset improvement work. This gives the company exposure to both new project spending and recurring work on existing facilities.
The recent financial flow also shows a business with very high revenue but structurally modest margins, which is typical for engineering and project services. Revenue climbed from around $9.7 billion in fiscal 2022 to nearly $11.8 billion in fiscal 2024, then eased to about $10.7 billion in fiscal 2026. Operating income and net income improved meaningfully after a weak fiscal 2023, but fiscal 2026 shows a softer year again, with lower gross profit and lower earnings than fiscal 2025.
The broader pattern is clear: Worley converts a large revenue base into a much smaller profit pool, so contract discipline and execution quality have an outsized impact on returns.
Key Figures
| Metric | Value | Sector ⓘ |
|---|---|---|
| Date | Oct 10, 2026 | |
| Context | ||
| Sector | Energy | |
| Industry | Oil & Gas Equipment & Services | |
| Market Cap ⓘ | $3.25B | |
| Beta ⓘ | 0.40 | |
Value (Cheapness) | ||
| P/E Ratio ⓘ | 20.81 | 14.91 |
| P/B Ratio ⓘ | 0.68 | 1.67 |
| FCF Yield ⓘ | 31.17% | 8.53% |
| Dividend Yield ⓘ | 5.21% | 3.63% |
| EBIT / EV ⓘ | N/A | 7.44% |
| PEG ⓘ | 1.02 | |
Growth (Business expansion) | ||
| Revenue Growth ⓘ | -7.90% | 27.10% |
| RPS Growth (5Y CAGR) ⓘ | 3.38% | 6.85% |
| EPS Growth (5Y CAGR) ⓘ | 30.07% | -15.33% |
| BVPS Growth (5Y CAGR) ⓘ | -2.78% | 6.02% |
| Margin Growth (5Y Trend) ⓘ | 0.50% | 0.64% |
| FCF Growth (5Y CAGR) ⓘ | 6.47% | 3.59% |
| DPS Growth (5Y CAGR) ⓘ | -0.06% | 16.79% |
Quality (Business durability) | ||
| ROIC (Latest) ⓘ | 9.00% | 11.33% |
| ROA (Latest) ⓘ | 6.00% | 6.03% |
| ROIC (5Y Median) ⓘ | 3.91% | 10.19% |
| ROA (5Y Median) ⓘ | 2.19% | 5.40% |
| Net Debt / EBIT (Latest) ⓘ | 1.60 | 1.60 |
| Net Debt / EBIT (5Y Median) ⓘ | 3.22 | 1.91 |
| Net Debt / EBITDA (Latest) ⓘ | 1.06 | 1.05 |
| Net Debt / Assets ⓘ | 16.27% | 17.29% |
| EBITDA / Interest ⓘ | 7.37 | 9.65 |
| Operating Margin (Latest) ⓘ | 4.97% | 16.21% |
| Operating Margin (5Y Median) ⓘ | 5.07% | 19.99% |
| Debt to Equity (Latest) ⓘ | 58.25% | 54.41% |
| Profit Margin (Latest) ⓘ | 2.22% | 8.79% |
| Free Cash Flow (Latest) ⓘ | $1.01B | |
Momentum (Price trend) | ||
| 3Y Return ⓘ | -30.02% | +70.76% |
| 12M Return (excl. last month) ⓘ | -22.98% | +46.44% |
| 6M Return ⓘ | -14.17% | +0.36% |
| Price vs. 200-Day MA ⓘ | -16.68% | +8.00% |
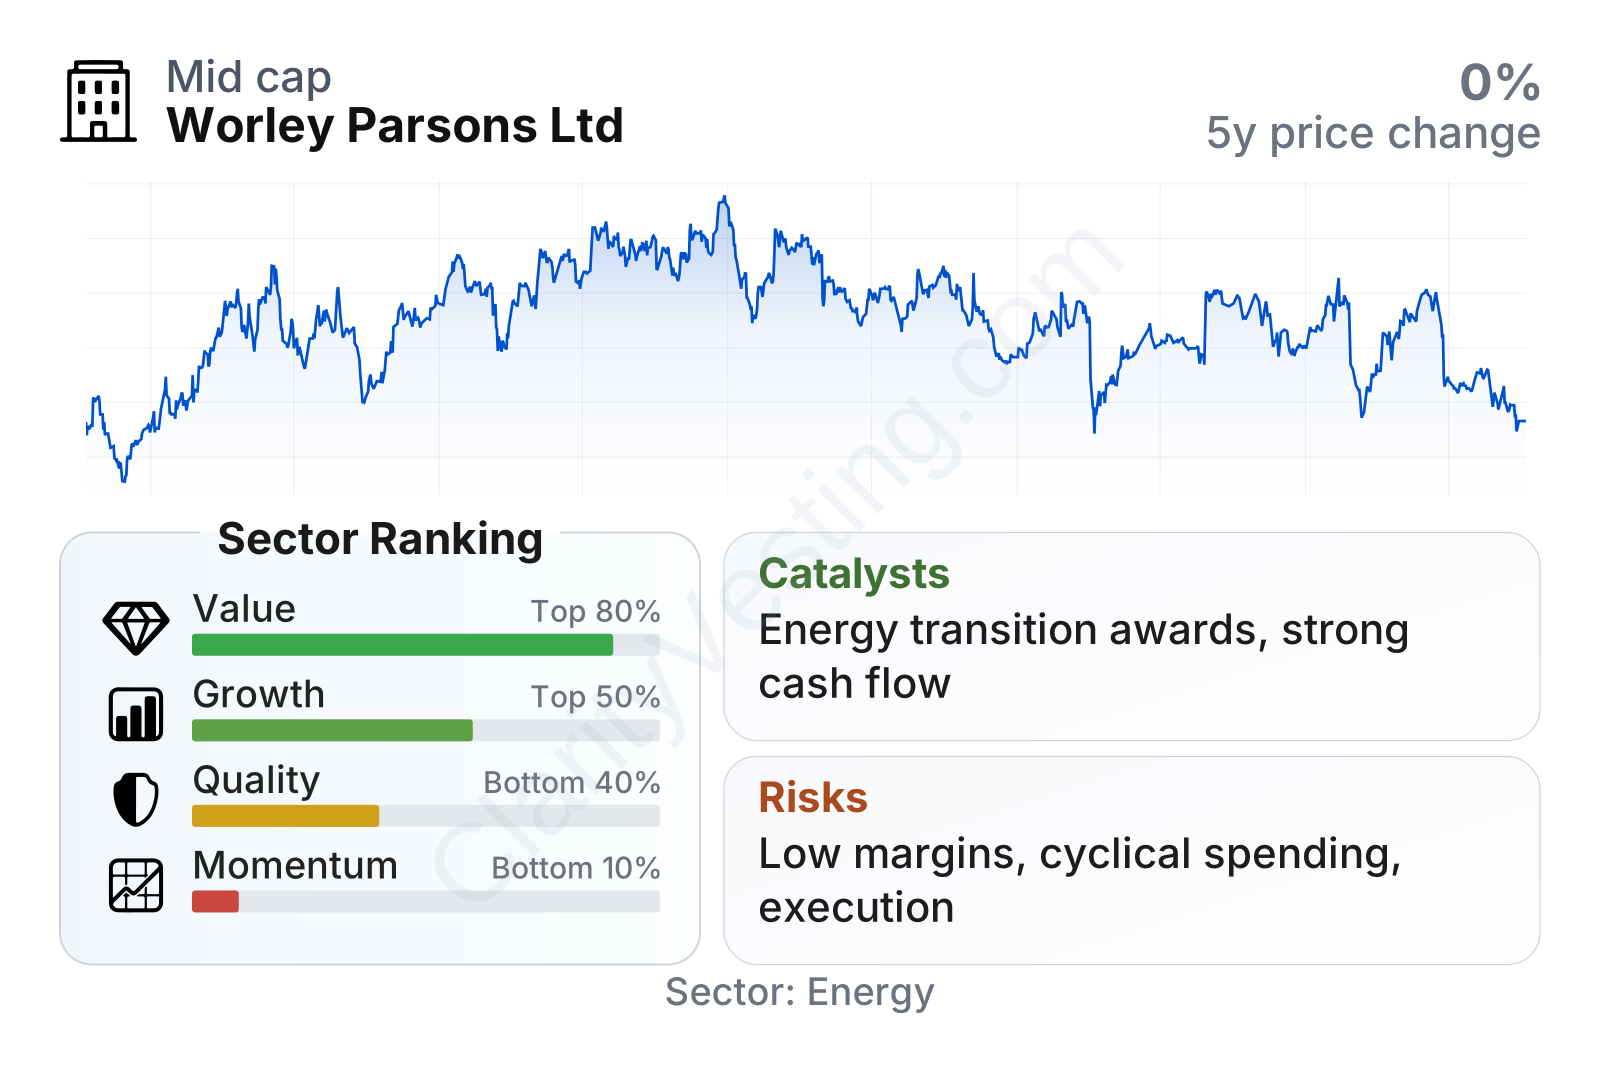
Worley is a mid-sized company by public market standards, and its stock has shown relatively low share-price volatility, with a beta around 0.4. On valuation measures, the picture is mixed. The earnings multiple sits above the sector median, but the price-to-book ratio is well below the sector median, while free cash flow yield and dividend yield both look strong relative to peers. That combination usually suggests the market is giving credit to cash generation but remains cautious about the durability of margins and growth.
The factor breakdown supports that interpretation. The company ranks well on value and around the middle of the pack on growth, but weaker on quality and especially on momentum. Revenue growth has recently lagged the sector, yet five-year earnings growth and free cash flow growth have been better than many peers. In other words, Worley has improved parts of the income statement and cash profile over time, but the market has not rewarded it with stronger share-price performance.
Growth
Worley operates in a sector with long-term relevance, but it is not a simple straight-line growth story. The traditional side of the business still depends heavily on energy, chemicals, and resource capital spending. Those end markets remain large because the world continues to need oil, gas, refining, mining, and industrial infrastructure. At the same time, many customers are redirecting spending toward lower-carbon projects, electrification, carbon capture, hydrogen, sustainable fuels, and efficiency upgrades. That trend gives engineering firms like Worley a realistic path to stay important even as the energy system evolves.
Its strategy makes industrial sense. The company already serves large asset-heavy customers, so it can use existing client relationships and engineering capabilities to win work across both conventional and transition-related projects. That is often more practical than building an entirely new business from scratch. The key question is not whether these opportunities exist, but whether Worley can convert them into consistent margin expansion and steadier revenue growth.
A potentially important catalyst is the company’s exposure to brownfield and maintenance work alongside major capital projects. Operators are still spending to keep existing facilities productive, safer, and less emissions-intensive. That can provide a more resilient source of demand than relying only on huge new builds. Another support is cash generation: free cash flow has strengthened materially in the most recent periods, which gives the company more flexibility for debt management, dividends, and selective reinvestment.
The rise in trailing free cash flow into 2025 points to improved cash conversion, even though accounting margins remain relatively thin. For a services business, that matters because strong cash flow can cushion periods when project timing or profitability becomes uneven.
Recent company updates have also highlighted contract awards and ongoing positioning in sustainability-linked engineering opportunities. Those developments are meaningful because the market increasingly values firms that can bridge today’s hydrocarbon spending with tomorrow’s lower-emission capital cycle.
Risks
This article is for informational purposes only and does not constitute financial advice. Some content is AI-generated. See Disclaimer


