Stock Analysis · WuXi Biologics (WXIBF)
Overview
WuXi Biologics is a contract research, development, and manufacturing company focused on biologic drugs. In simple terms, it helps pharmaceutical and biotechnology companies move complex medicines from early laboratory work to large-scale commercial production. Its clients use the company for services such as cell line development, process development, clinical manufacturing, commercial manufacturing, and some testing support. This makes WuXi Biologics part of the fast-growing outsourcing segment of the drug industry, where smaller biotech firms and large pharmaceutical companies rely on specialized partners instead of building every capability in-house.
The business model is built around long customer relationships. A drug program can start with early-stage development services and, if successful, continue into clinical trials and eventually commercial supply. That creates a pipeline effect: many small programs begin early, while a smaller number mature into much larger manufacturing contracts. This structure can produce recurring revenue over time, but it also means results depend on how many customer drug candidates progress successfully.
Based on company reporting, revenue is mainly generated from biologics discovery, development, and manufacturing services, with manufacturing-related work representing the largest contribution because later-stage and commercial projects typically carry larger contract values. A simplified breakdown is:
- Manufacturing services: approximately 60% to 70% of revenue. This includes clinical-stage and commercial production of biologic drug substances and related supply work.
- Development services: approximately 20% to 30% of revenue. This covers process development, cell line development, formulation work, and preparation for clinical production.
- Research and other services: approximately 5% to 15% of revenue. This includes earlier-stage laboratory support and selected testing or ancillary services.
Geographically, the company has historically had meaningful exposure to global biotechnology customers, especially from North America and China, while also serving Europe and other markets through its international site network. That global footprint matters because customers often want manufacturing options across multiple jurisdictions.
The company’s profit structure has improved again after a more difficult stretch. Revenue has expanded strongly over the past several years, and recent periods show a healthier conversion of sales into operating profit and net income than in 2023 and 2024. Cost of revenue remains the largest expense, as expected in a manufacturing-heavy model, while selling and administrative costs have also risen as the company scales globally.
Over the last five years, sales have roughly doubled, while operating profit and net income have been more volatile. The notable point is that 2025 shows a stronger rebound in profitability, suggesting better utilization and operating leverage after a period when margin pressure had become more visible.
Key Figures
| Metric | Value | Sector ⓘ |
|---|---|---|
| Date | Oct 24, 2026 | |
| Context | ||
| Sector | Healthcare | |
| Industry | Biotechnology | |
| Market Cap ⓘ | $26.18B | |
| Beta ⓘ | 0.59 | |
Value (Cheapness) | ||
| P/E Ratio ⓘ | 37.41 | 25.42 |
| P/B Ratio ⓘ | 0.46 | 3.08 |
| FCF Yield ⓘ | 23.61% | 3.12% |
| Dividend Yield ⓘ | N/A | 1.85% |
| EBIT / EV ⓘ | N/A | 0.56% |
| PEG ⓘ | 0.63 | |
Growth (Business expansion) | ||
| Revenue Growth ⓘ | 18.40% | 7.50% |
| RPS Growth (5Y CAGR) ⓘ | 21.57% | 8.60% |
| EPS Growth (5Y CAGR) ⓘ | 77.94% | -17.73% |
| BVPS Growth (5Y CAGR) ⓘ | 8.01% | 3.72% |
| Margin Growth (5Y Trend) ⓘ | -8.68% | -0.57% |
| FCF Growth (5Y CAGR) ⓘ | N/A | 0.96% |
| DPS Growth (5Y CAGR) ⓘ | N/A | 6.69% |
Quality (Business durability) | ||
| ROIC (Latest) ⓘ | N/A | 3.17% |
| ROA (Latest) ⓘ | 14.92% | 2.98% |
| ROIC (5Y Median) ⓘ | 11.03% | 4.56% |
| ROA (5Y Median) ⓘ | 7.92% | 1.87% |
| Net Debt / EBIT (Latest) ⓘ | -0.46 | 1.34 |
| Net Debt / EBIT (5Y Median) ⓘ | -0.94 | 1.86 |
| Net Debt / EBITDA (Latest) ⓘ | -0.37 | 1.00 |
| Net Debt / Assets ⓘ | -9.47% | 5.06% |
| EBITDA / Interest ⓘ | 62.42 | 9.55 |
| Operating Margin (Latest) ⓘ | 31.00% | 9.25% |
| Operating Margin (5Y Median) ⓘ | 30.50% | 7.33% |
| Debt to Equity (Latest) ⓘ | 5.67% | 26.68% |
| Profit Margin (Latest) ⓘ | 21.20% | 3.34% |
| Free Cash Flow (Latest) ⓘ | $6.18B | |
Momentum (Price trend) | ||
| 3Y Return ⓘ | -13.73% | +51.61% |
| 12M Return (excl. last month) ⓘ | +20.20% | +19.90% |
| 6M Return ⓘ | +16.09% | +10.10% |
| Price vs. 200-Day MA ⓘ | +33.11% | +6.44% |
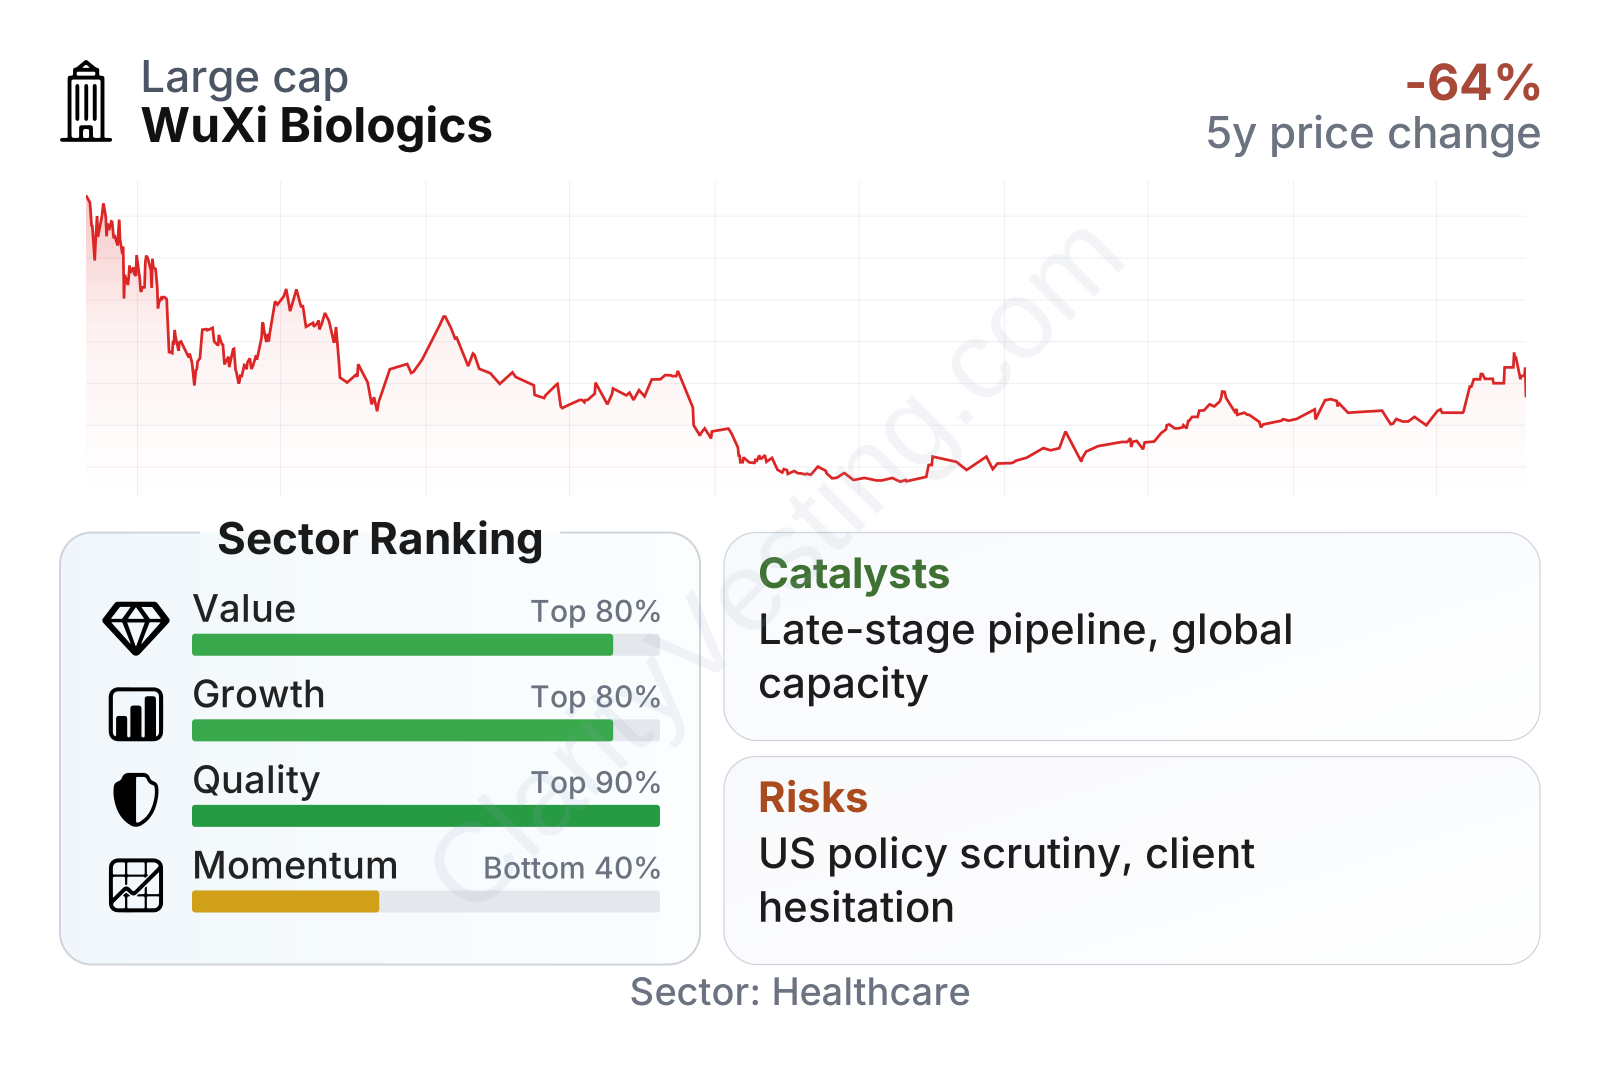
WuXi Biologics ranks well on growth and business quality relative to much of the healthcare sector. Revenue growth is running well above the sector median, and five-year expansion in revenue per share has also been strong. Profitability remains a standout feature: operating margin is around 31% and profit margin about 21%, both far higher than typical sector levels. Balance-sheet strength is another clear positive, with very low debt relative to equity and net cash-like leverage metrics.
Valuation signals are mixed rather than uniformly cheap or expensive. The earnings multiple is above the sector median on the latest snapshot, but other measures look much more conservative, including a very low price-to-book ratio and a PEG ratio below 1. Free cash flow generation is unusually strong for the sector, which helps explain why the shares can look expensive on one metric and restrained on another.
The stock chart also highlights how unusual the recent history has been. Shares fell sharply from 2021 through early 2024, then recovered meaningfully into 2025 and 2026. That pattern suggests the market has already reassessed some of the earlier pessimism, but it also shows that sentiment around the name can change quickly.
Growth
WuXi Biologics operates in a part of healthcare with durable long-term demand drivers. Biologic medicines remain one of the most important areas of drug development, including antibody therapies, immunology treatments, and other complex large-molecule drugs. These products are difficult and expensive to develop and manufacture, which supports demand for specialized outsourcing partners. Even large pharmaceutical groups often prefer external capacity for flexibility, speed, and access to technical know-how.
The company’s strategy is logical for that backdrop. It has built an end-to-end platform, meaning a client can start with early development and stay with the same provider through clinical and commercial manufacturing. That lowers switching friction and can deepen customer relationships. The larger opportunity is not just winning one-off projects but capturing more value as customer programs move from small development contracts into long-duration supply agreements.
Recent growth indicators remain encouraging. Year-over-year revenue growth is around the high-teens level, clearly ahead of the broader sector median. Over a five-year period, revenue per share growth has also been much stronger than most peers. That matters because it suggests expansion has not only come from acquisitions or financial engineering but from underlying business scaling.
A major catalyst is the continued maturation of the company’s project portfolio. In this industry, the economics improve as clients move from discovery and early development into late-stage clinical production and then commercial manufacturing. Each successful transition can raise contract value substantially. Another catalyst is the broader industry need for biologics capacity outside a single country, which can favor suppliers with international production sites and regulatory experience across regions.
There is also a strategic opportunity linked to industry restructuring. Some biotech companies remain cost-conscious and prefer outsourcing instead of building internal manufacturing plants, while larger drugmakers increasingly want more flexible external capacity. If that trend persists, specialized contract manufacturers with established quality systems and global scale can capture more demand.
Risks
This article is for informational purposes only and does not constitute financial advice. Some content is AI-generated. See Disclaimer


