Stock Analysis · Willis Towers Watson PLC (WTW)
Overview
Willis Towers Watson PLC is a global advisory, broking, and solutions company. In simple terms, it helps businesses manage employee benefits, insurance costs, workplace risk, and a wide range of corporate financial exposures. Its clients include large employers, insurers, public entities, and multinational companies that need advice on health plans, retirement programs, risk transfer, and human capital decisions.
The company operates through two main segments. Based on recent annual reporting, revenue is roughly split as follows:
- Health, Wealth & Career: about 55% of revenue. This segment includes employee benefits broking, health and welfare consulting, retirement consulting, investment advisory, and talent and compensation advice.
- Risk & Broking: about 45% of revenue. This business places commercial insurance, advises clients on risk management, and supports corporate customers across property, casualty, cyber, and other specialty lines.
That mix matters because it gives Willis Towers Watson exposure to two durable corporate spending categories: protecting people and protecting balance sheets. Unlike an insurer, it does not usually take underwriting risk on its own balance sheet in the same way a carrier does; instead, it earns fees and commissions for advice, placement, and related services.
The broader financial profile shows a business with recurring client relationships, solid cash generation, and margins that can improve meaningfully when operations run smoothly. Revenue has generally trended upward over the last several years, while earnings have been more uneven because of restructuring, integration work, and accounting items that have affected bottom-line results from time to time.
Over the past several years, revenue has moved from just under $9.0 billion to around $9.7 billion to $9.9 billion, showing a broadly stable growth path rather than a straight line. Profitability, however, has been much more volatile, with a weak 2024 followed by a clear rebound in 2025. That pattern suggests the main debate is less about demand for the company’s services and more about how efficiently management converts that demand into earnings.
Key Figures
| Metric | Value | Sector ⓘ |
|---|---|---|
| Date | Oct 17, 2026 | |
| Context | ||
| Sector | Financial Services | |
| Industry | Insurance Brokers | |
| Market Cap ⓘ | $27.59B | |
| Beta ⓘ | 0.47 | |
Value (Cheapness) | ||
| P/E Ratio ⓘ | 18.38 | 12.26 |
| P/B Ratio ⓘ | 3.84 | 1.23 |
| FCF Yield ⓘ | 6.14% | 10.40% |
| Dividend Yield ⓘ | 0.63% | 3.02% |
| EBIT / EV ⓘ | 8.00% | 8.14% |
| PEG ⓘ | 1.08 | |
Growth (Business expansion) | ||
| Revenue Growth ⓘ | 9.10% | 9.35% |
| RPS Growth (5Y CAGR) ⓘ | 8.89% | 12.19% |
| EPS Growth (5Y CAGR) ⓘ | -15.87% | -9.53% |
| BVPS Growth (5Y CAGR) ⓘ | -6.05% | 4.99% |
| Margin Growth (5Y Trend) ⓘ | -9.01% | -3.86% |
| FCF Growth (5Y CAGR) ⓘ | -4.52% | 4.81% |
| DPS Growth (5Y CAGR) ⓘ | 5.68% | 8.79% |
Quality (Business durability) | ||
| ROIC (Latest) ⓘ | 13.20% | 9.49% |
| ROE (Latest) ⓘ | 20.50% | 13.90% |
| ROA (Latest) ⓘ | 5.40% | 1.55% |
| ROIC (5Y Median) ⓘ | 10.82% | 7.86% |
| ROE (5Y Median) ⓘ | 10.88% | 12.17% |
| ROA (5Y Median) ⓘ | 3.47% | 1.30% |
| Net Debt / EBIT (Latest) ⓘ | 2.37 | 0.96 |
| Net Debt / EBIT (5Y Median) ⓘ | 2.88 | 0.73 |
| Net Debt / EBITDA (Latest) ⓘ | 2.00 | 0.92 |
| Operating Margin (Latest) ⓘ | 22.85% | 22.30% |
| Operating Margin (5Y Median) ⓘ | 16.54% | 24.63% |
| Debt to Equity (Latest) ⓘ | 92.34% | 58.56% |
| Profit Margin (Latest) ⓘ | 15.49% | 26.57% |
| Free Cash Flow (Latest) ⓘ | $1.70B | |
Momentum (Price trend) | ||
| 3Y Return ⓘ | +49.80% | +88.33% |
| 12M Return (excl. last month) ⓘ | -2.31% | +19.38% |
| 6M Return ⓘ | +6.98% | +4.75% |
| Price vs. 200-Day MA ⓘ | +5.11% | +3.50% |
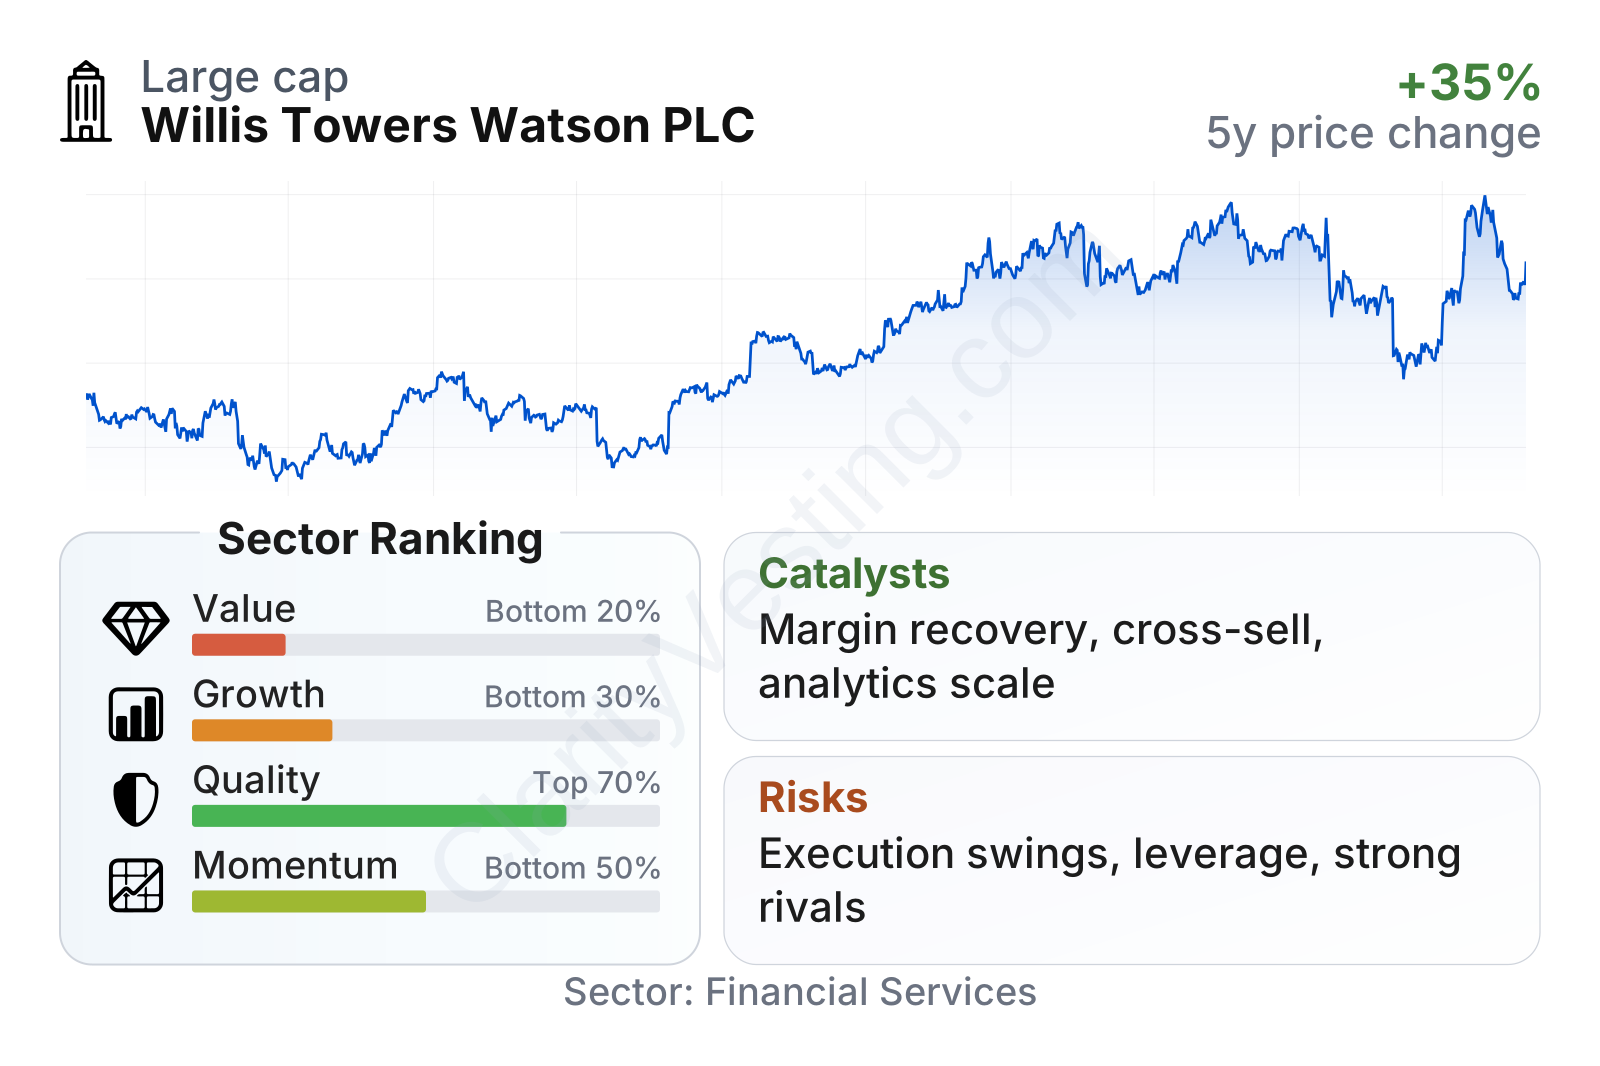
Willis Towers Watson is a large-cap company with notably low share-price volatility, as shown by a beta well below 1. On quality measures, the business looks stronger than many peers: returns on invested capital, equity, and assets are all above sector medians on a trailing basis. The weaker area is valuation, where the shares trade above sector norms on earnings and especially on book value. Growth and momentum also rank in the lower part of the sector, reflecting slower multi-year expansion and a stock that has recently lagged many financial services names.
The stock-price history shows a strong climb from 2022 through late 2025, followed by a pullback and then a flatter pattern in 2026. That kind of setup often reflects a market that still credits the franchise quality but has become more selective about the pace and reliability of future earnings growth.
Growth
Willis Towers Watson operates in a sector that has favorable long-term characteristics. Employers continue to face rising healthcare costs, more complex retirement obligations, stricter governance expectations, and greater need for compensation and workforce planning. At the same time, commercial insurance markets have become more complicated, with higher claims severity, more cybersecurity concerns, and ongoing demand for specialist broking. These are not temporary issues, which supports a recurring need for external advice.
The company’s strategy also makes practical sense for future growth. Its model benefits from long-standing corporate relationships, cross-selling between benefits consulting and risk broking, and the increasing value of analytics in pricing, plan design, and workforce decisions. In a business like this, scale matters because large multinational clients often prefer a provider that can coordinate across countries and service lines.
A visible catalyst is margin recovery. The earnings trend has improved after a difficult period, and that matters because even modest revenue growth can produce a stronger rise in profit if cost discipline improves.
Earnings per share have moved upward from the low-to-mid teens in recent years to a higher level in 2024 and 2025, pointing to a business that has regained operating traction. The first half of 2026 does not yet represent a full-year result, but the broader direction is more favorable than the five-year compounded figures might suggest.
Another useful indicator is book value per share. For a service business, this is not as central as it would be for a bank or insurer, but it still shows whether shareholder value is compounding on a per-share basis after buybacks, restructuring charges, and profit swings.
Book value per share has been uneven and remains below the level seen several years ago. That is a reminder that recent earnings improvement has not fully translated into a consistently rising capital base. Still, the company’s ability to generate free cash flow of roughly $1.7 billion over the last twelve months gives management flexibility for dividends, repurchases, debt management, and selective investment.
Recent company updates have also pointed to ongoing technology and operating-model improvements. For a broker and consulting group, better data tools and workflow automation can strengthen client retention and help lift margins over time, even if they do not create dramatic top-line growth on their own.
Risks
This article is for informational purposes only and does not constitute financial advice. Some content is AI-generated. See Disclaimer


