Stock Analysis · W.T.B. Financial Corporation (WTBFA)
Overview
W.T.B. Financial Corporation is the holding company for Washington Trust Bank, a long-established regional bank based in Spokane, Washington. The group provides traditional banking services to individuals, businesses, and professional clients, with a footprint centered on the Pacific Northwest and nearby western markets. Its activities are typical of a community and regional banking model: gathering deposits, making loans, earning interest income, and offering fee-based financial services.
The business is primarily driven by spread income, meaning the difference between what the bank earns on loans and securities and what it pays on deposits and borrowings. A smaller but still useful portion comes from service fees, wealth-related activities, card and treasury services, and other banking charges. Based on recent annual reporting and the revenue mix visible over the last few years, the company’s revenue sources can be summarized approximately as follows:
- Net interest income after provision-related effects: about 75% to 85% — income generated from commercial loans, real estate lending, consumer lending, and the securities portfolio, offset by funding costs.
- Noninterest income: about 15% to 25% — includes deposit account fees, bank card revenue, mortgage banking-related items when active, trust and investment service fees, treasury management, and other service charges.
That mix makes W.T.B. Financial largely a classic regional bank rather than a diversified financial conglomerate. The revenue trend over the past several years shows that total revenue expanded meaningfully from 2021 through 2025, but profitability was pressured in 2023 and 2024 as funding costs rose sharply before improving again in 2025. In other words, the bank grew its top line, yet margins were sensitive to the higher-rate environment.
The long-term pattern is notable: revenue climbed materially between 2021 and 2025, while net income dipped in 2023 and 2024 before recovering in 2025. This suggests the franchise remained capable of generating business volume, but earnings were heavily influenced by interest expense and margin pressure rather than by a collapse in customer activity.
Key Figures
| Metric | Value | Sector ⓘ |
|---|---|---|
| Date | Oct 03, 2026 | |
| Context | ||
| Sector | Financial Services | |
| Industry | Banks - Regional | |
| Market Cap ⓘ | $1.67B | |
| Beta ⓘ | 0.19 | |
Value (Cheapness) | ||
| P/E Ratio ⓘ | 13.82 | 12.60 |
| P/B Ratio ⓘ | 1.57 | 1.23 |
| FCF Yield ⓘ | 1.13% | 10.16% |
| Dividend Yield ⓘ | 1.09% | 2.96% |
| EBIT / EV ⓘ | N/A | 7.77% |
| PEG ⓘ | N/A | |
Growth (Business expansion) | ||
| Revenue Growth ⓘ | 21.60% | 9.50% |
| RPS Growth (5Y CAGR) ⓘ | 11.48% | 12.10% |
| EPS Growth (5Y CAGR) ⓘ | -14.73% | -9.45% |
| BVPS Growth (5Y CAGR) ⓘ | 5.49% | 5.01% |
| Margin Growth (5Y Trend) ⓘ | -21.43% | -4.07% |
| FCF Growth (5Y CAGR) ⓘ | 15.89% | 4.96% |
| DPS Growth (5Y CAGR) ⓘ | -0.46% | 8.79% |
Quality (Business durability) | ||
| ROIC (Latest) ⓘ | N/A | 9.60% |
| ROE (Latest) ⓘ | 11.83% | 13.84% |
| ROA (Latest) ⓘ | 1.13% | 1.53% |
| ROIC (5Y Median) ⓘ | N/A | 7.86% |
| ROE (5Y Median) ⓘ | 9.69% | 12.20% |
| ROA (5Y Median) ⓘ | 0.87% | 1.29% |
| Net Debt / EBIT (Latest) ⓘ | N/A | 0.91 |
| Net Debt / EBIT (5Y Median) ⓘ | -1.55 | 0.74 |
| Net Debt / EBITDA (Latest) ⓘ | 2.44 | 0.97 |
| Operating Margin (Latest) ⓘ | N/A | 22.12% |
| Operating Margin (5Y Median) ⓘ | 24.18% | 24.39% |
| Debt to Equity (Latest) ⓘ | 48.86% | 60.37% |
| Profit Margin (Latest) ⓘ | 25.55% | 26.62% |
| Free Cash Flow (Latest) ⓘ | $18.84M | |
Momentum (Price trend) | ||
| 3Y Return ⓘ | -25.44% | +89.23% |
| 12M Return (excl. last month) ⓘ | +24.30% | +17.35% |
| 6M Return ⓘ | +18.73% | +10.00% |
| Price vs. 200-Day MA ⓘ | +25.75% | +3.73% |
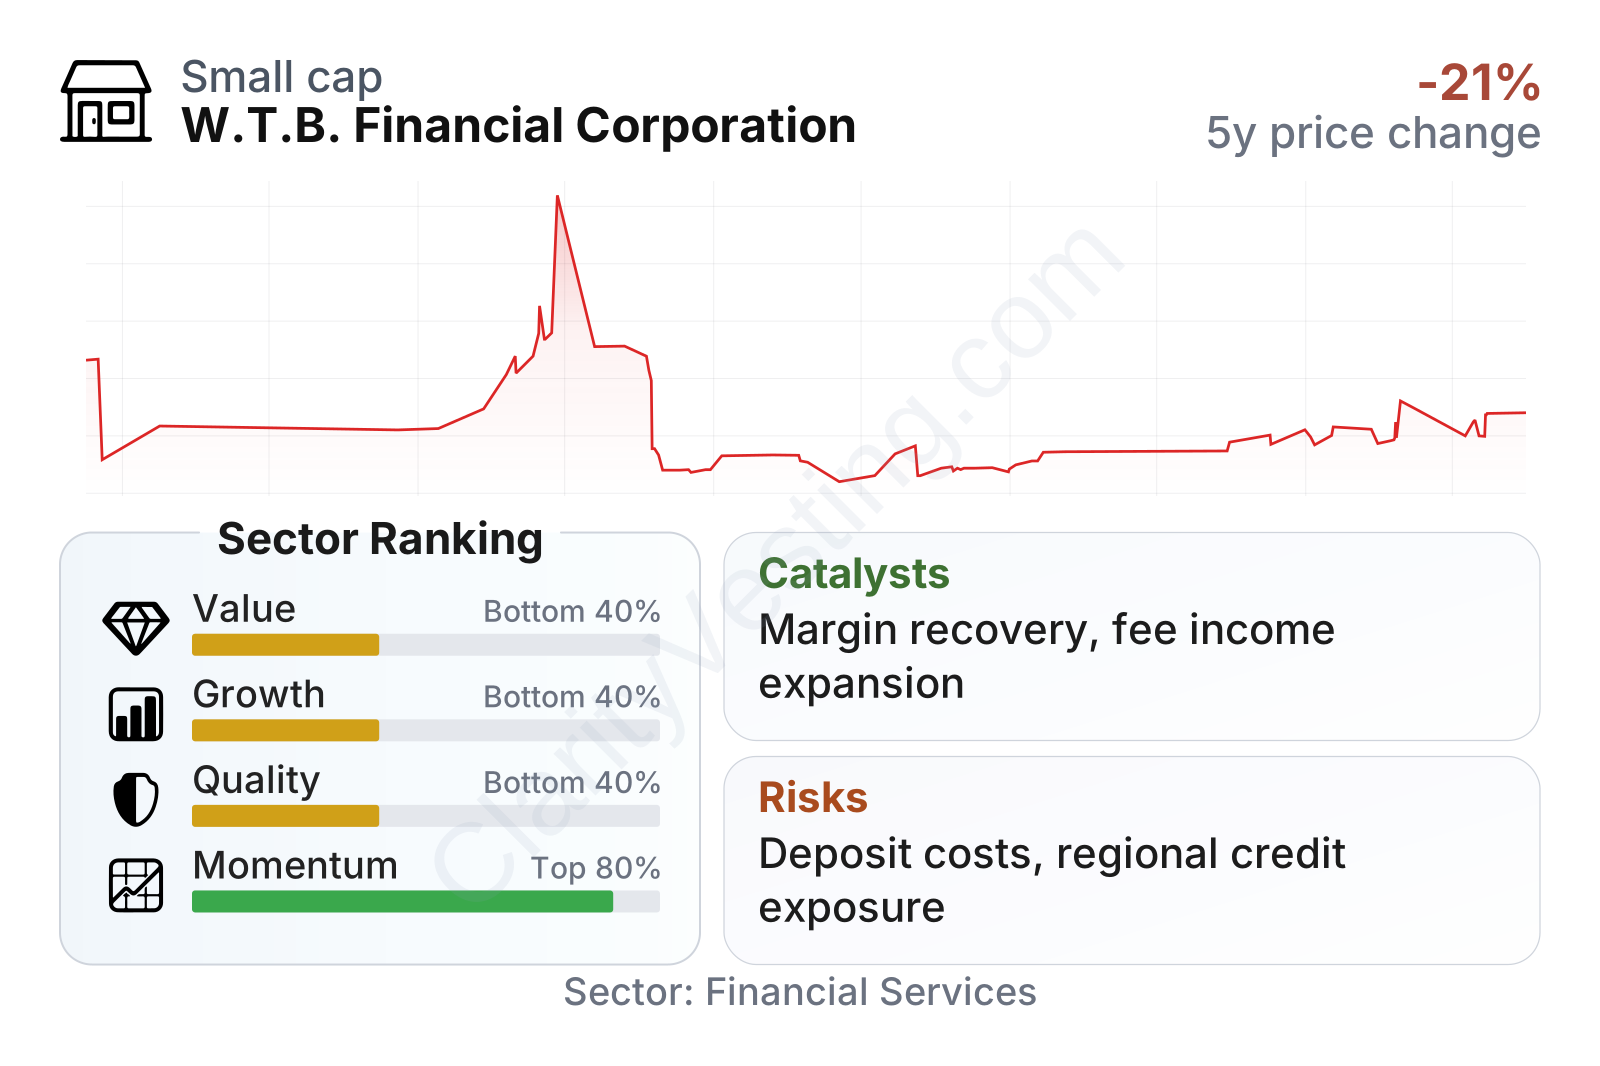
W.T.B. Financial sits in the small-to-mid-sized regional bank range by market value and has a very low beta, which points to historically limited share-price volatility relative to the broader market. On valuation, the stock trades close to the banking sector’s typical earnings range but at a somewhat higher price-to-book multiple. On quality and growth, the picture is mixed: recent revenue growth has been strong, but longer-term earnings growth and profitability measures remain below sector medians. Momentum has improved over the last year, yet the three-year share-price record is still weaker than the broader regional bank group.
The stock-price history reflects that pattern. Shares remain below the 2021 peak, but they recovered noticeably from the 2025 low. That rebound aligns with improving earnings after the difficult margin period that affected many banks when deposit costs reset upward.
Growth
Regional banking is not a high-growth industry in the same way as software or semiconductors, but it remains structurally important and can expand steadily when population, business formation, commercial activity, and household wealth rise in its core markets. W.T.B. Financial operates in western states where long-term economic activity has generally benefited from business migration, real estate development, health care, professional services, and small-to-mid-sized enterprise lending. That creates a workable backdrop for measured balance-sheet growth.
The company’s strategy appears sensible for a bank of its size: stay focused on relationship banking, commercial clients, and core regional markets rather than pursuing aggressive national expansion. For long-term analysis, this matters because smaller banks often perform best when they are disciplined underwriters with sticky customer relationships. The latest annual trend also suggests that earnings recovery is possible when interest-cost pressure eases or loan yields reprice favorably.
Earnings per share show a clear cycle rather than a straight line. Results were strong in 2021 and 2022, dropped sharply in 2023, stayed subdued in 2024, and then recovered in 2025. That rebound is important because it indicates the earlier decline was not simply a permanent erosion of the franchise. At the same time, the five-year earnings trend is still negative overall, so the recovery needs to prove durable.
Book value per share has moved upward consistently over the last five years, with growth roughly in line with the industry median. For a bank, that is a constructive sign because book value represents the capital base that supports future lending and earnings. The steady rise suggests the institution continued to build shareholder equity despite the difficult profit period.
A practical catalyst for future growth is margin normalization. If deposit costs stabilize while asset yields remain supportive, net interest income can improve without requiring unusually fast loan growth. Another possible tailwind is continued expansion in commercial banking, treasury services, and wealth-related fee revenue, which can add earnings without relying entirely on balance-sheet size. Recent operating improvement after the 2023-2024 pressure period makes that possibility more credible than it did one year earlier.
Risks
This article is for informational purposes only and does not constitute financial advice. Some content is AI-generated. See Disclaimer


