Stock Analysis · WSFS Financial Corporation (WSFS)
Overview
WSFS Financial Corporation is a regional banking company based in the Mid-Atlantic region of the United States. Through WSFS Bank and its related businesses, it provides traditional banking services such as commercial loans, consumer lending, deposit accounts, cash management, and mortgage banking. It also has a sizable wealth and trust operation, which makes the business more diversified than many smaller regional banks that rely mainly on lending.
The company’s revenue base comes primarily from interest earned on loans and securities, supplemented by fee-based businesses that can be steadier across credit cycles. Based on recent annual reporting, the main sources of revenue are approximately:
- Net interest income: about 69% to 73% — income from loans, leases, investment securities, and other interest-earning assets, after paying interest on deposits and borrowings.
- Wealth and trust fee revenue: about 11% to 14% — private wealth management, institutional services, trust administration, investment advisory, and related fiduciary services.
- Service charges and card-related fees: about 7% to 10% — deposit account fees, debit card activity, merchant services, treasury management, and other everyday banking charges.
- Mortgage banking and loan-related fees: about 3% to 6% — mortgage originations, sales, servicing-related activities, and certain lending fees.
- Other noninterest income: about 5% to 8% — capital markets activity, BOLI income, leasing-related items, and other miscellaneous fee streams.
That mix matters for long-term analysis: WSFS is still mainly a bank, but its trust and fee businesses reduce dependence on lending spreads alone. Over the last several years, total revenue has expanded materially, while profit has remained comparatively resilient even as funding costs rose across the banking sector.
The business has grown revenue strongly since 2021, with net income holding in a fairly stable range despite higher interest expense. That suggests the company has been able to offset part of the industry’s margin pressure through scale, pricing, and fee income, although expense control remains important.
Key Figures
| Metric | Value | Sector ⓘ |
|---|---|---|
| Date | Oct 17, 2026 | |
| Context | ||
| Sector | Financial Services | |
| Industry | Banks - Regional | |
| Market Cap ⓘ | $3.87B | |
| Beta ⓘ | 0.83 | |
Value (Cheapness) | ||
| P/E Ratio ⓘ | 12.66 | 12.26 |
| P/B Ratio ⓘ | 1.45 | 1.23 |
| FCF Yield ⓘ | 6.29% | 10.40% |
| Dividend Yield ⓘ | 0.94% | 3.02% |
| EBIT / EV ⓘ | 25.50% | 8.14% |
| PEG ⓘ | 0.98 | |
Growth (Business expansion) | ||
| Revenue Growth ⓘ | 8.80% | 9.35% |
| RPS Growth (5Y CAGR) ⓘ | 16.76% | 12.19% |
| EPS Growth (5Y CAGR) ⓘ | -6.46% | -9.53% |
| BVPS Growth (5Y CAGR) ⓘ | 5.51% | 4.99% |
| Margin Growth (5Y Trend) ⓘ | -27.72% | -3.86% |
| FCF Growth (5Y CAGR) ⓘ | 15.73% | 4.81% |
| DPS Growth (5Y CAGR) ⓘ | 7.69% | 8.79% |
Quality (Business durability) | ||
| ROIC (Latest) ⓘ | 10.70% | 9.49% |
| ROE (Latest) ⓘ | 11.66% | 13.90% |
| ROA (Latest) ⓘ | 1.47% | 1.55% |
| ROIC (5Y Median) ⓘ | 8.71% | 7.86% |
| ROE (5Y Median) ⓘ | 10.76% | 12.17% |
| ROA (5Y Median) ⓘ | 1.33% | 1.30% |
| Net Debt / EBIT (Latest) ⓘ | -5.27 | 0.96 |
| Net Debt / EBIT (5Y Median) ⓘ | -2.22 | 0.73 |
| Net Debt / EBITDA (Latest) ⓘ | -4.84 | 0.92 |
| Operating Margin (Latest) ⓘ | 31.34% | 22.30% |
| Operating Margin (5Y Median) ⓘ | 28.86% | 24.63% |
| Debt to Equity (Latest) ⓘ | 11.28% | 58.56% |
| Profit Margin (Latest) ⓘ | 29.72% | 26.57% |
| Free Cash Flow (Latest) ⓘ | $243.13M | |
Momentum (Price trend) | ||
| 3Y Return ⓘ | +118.31% | +88.33% |
| 12M Return (excl. last month) ⓘ | +47.33% | +19.38% |
| 6M Return ⓘ | +10.97% | +4.75% |
| Price vs. 200-Day MA ⓘ | +6.97% | +3.50% |
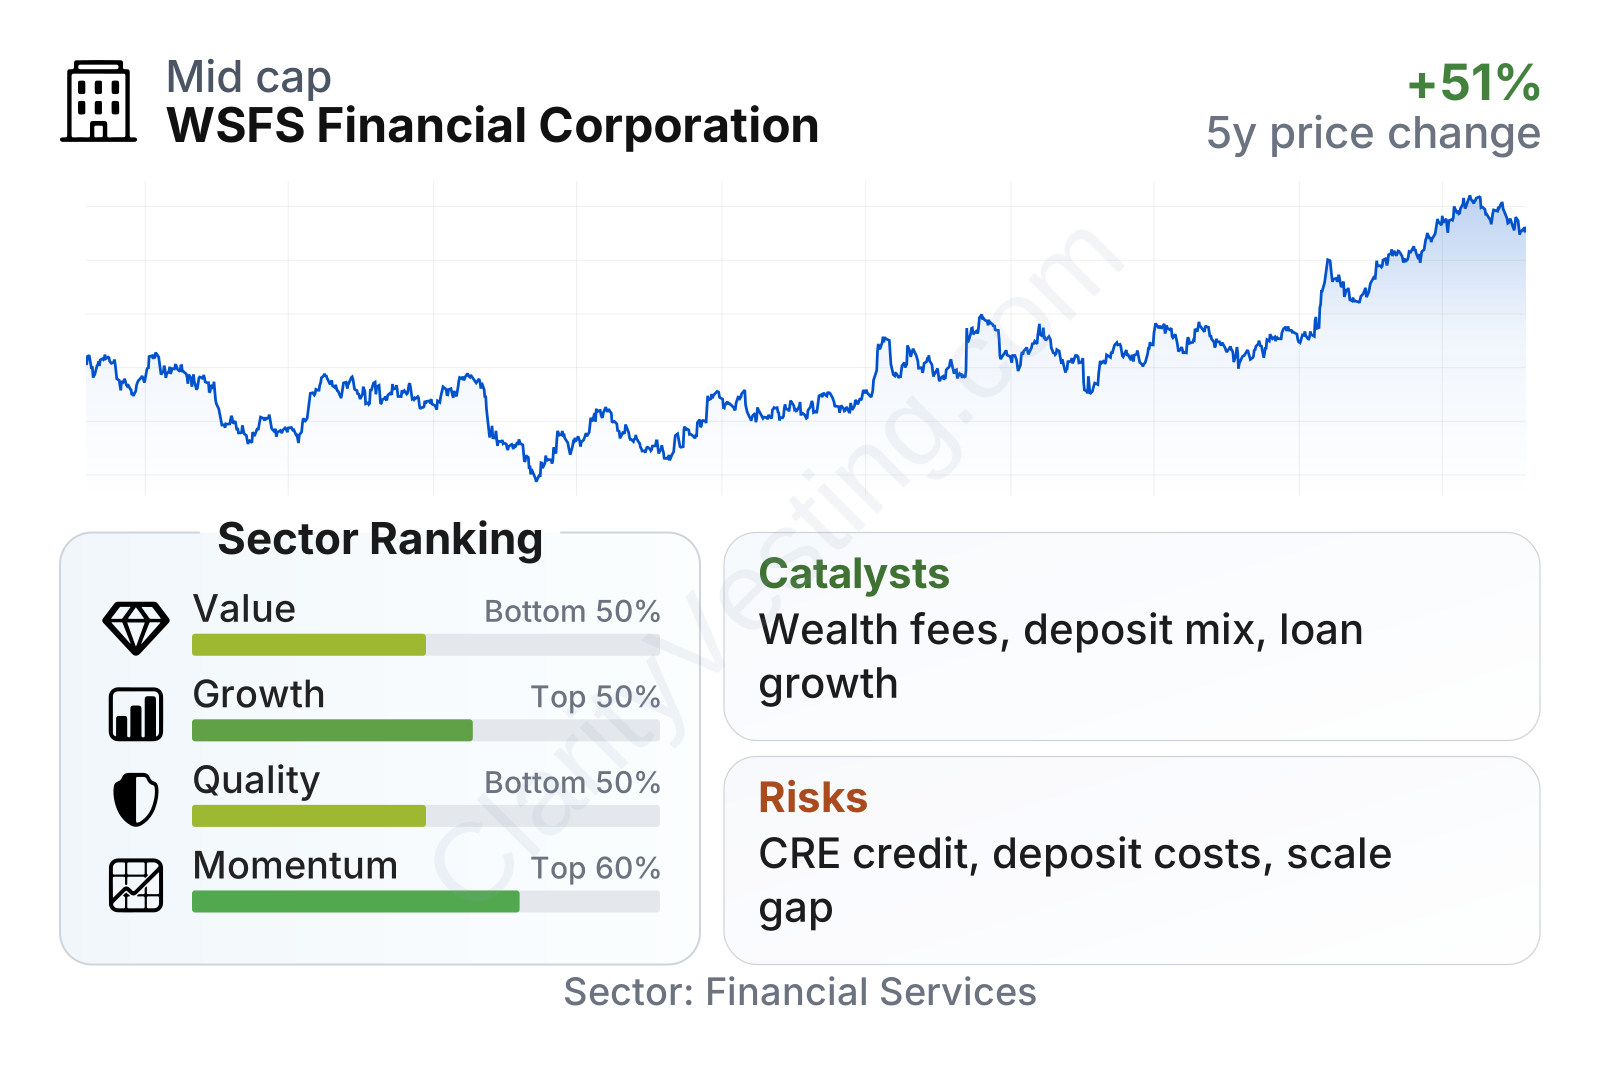
WSFS sits in the regional bank space with a market value in the mid-sized range and a below-market beta, which points to lower share-price volatility than many stocks. In the factor snapshot, growth and momentum look better than value and quality. The valuation picture is mixed: the earnings multiple is around the sector median, but the price-to-book ratio is somewhat above the regional bank median and the dividend yield is lower than average. Growth metrics are helped by solid multiyear revenue-per-share expansion and improving cash generation, while profitability measures remain respectable but not standout versus peers.
The stock-price history also shows a meaningful recovery from the 2023 regional bank stress period, followed by a strong advance into 2026. That recovery indicates improving market confidence, but it also means part of the normalization case has already been reflected in the share price.
Growth
The company operates in a mature sector rather than a high-growth one. Regional banking in itself is not a fast-expanding industry, but there are still durable growth pockets: commercial lending in attractive local markets, treasury and payments services for businesses, and wealth management for higher-balance clients and institutions. WSFS’s footprint in the Philadelphia, Delaware, and broader Mid-Atlantic corridor gives it access to economically active markets where relationship banking can still matter.
Its strategy appears sensible for long-term expansion because it combines three engines: balance-sheet growth, fee income growth, and disciplined acquisitions or business integration. The trust and wealth platform is especially important because it can deepen customer relationships without consuming capital in the same way that loan growth does. In a banking business, that can support steadier returns over time.
Earnings per share have not moved in a straight line, but they have shown resilience. After falling from the unusually strong 2021 level, earnings stabilized and then improved again in 2025. That pattern fits what many banks experienced as interest rates, deposit costs, and credit conditions shifted. For WSFS, the key point is that earnings have remained solid enough to support continued capital building rather than showing a lasting breakdown.
Book value per share, a useful measure for banks because it reflects the net value of assets after liabilities, has climbed meaningfully since 2022. That is a constructive sign. It suggests that the company has continued to add underlying balance-sheet value even while the operating environment became tougher. Over a long period, consistent growth in book value can be an important marker of a bank’s ability to compound.
Potential catalysts also exist. If deposit costs keep stabilizing, net interest margin could improve. Continued growth in wealth management and treasury services could raise the share of recurring fee income. In addition, any further commercial loan expansion in core Mid-Atlantic markets would support revenue growth without requiring a major change in the business model.
Recent company communications have also emphasized capital strength, liquidity, and ongoing business growth across core banking and wealth activities. In the current environment, that matters because regional banks that demonstrate stable funding and multiple revenue streams may have more room to keep expanding while weaker competitors remain cautious.
Risks
This article is for informational purposes only and does not constitute financial advice. Some content is AI-generated. See Disclaimer


