Stock Analysis · Wharf Real Estate Investment Company Limited (WRFRF)
Overview
Wharf Real Estate Investment Company Limited is a Hong Kong-focused property owner, developer, and operator. Its best-known assets include major shopping malls, office towers, hotels, and investment properties in prime locations such as Harbour City and Times Square. In practical terms, the company makes money by collecting rent from retail and office tenants, generating income from hotels, and selling completed development properties when projects are delivered.
The business mix is still led by recurring property income, but development sales can make results more volatile from year to year. Based on recent annual reporting and the company’s segment structure, the main sources of revenue are approximately:
- Investment properties: about 65% to 75% of revenue, mainly retail leasing and office leasing from landmark Hong Kong assets.
- Development properties: about 15% to 25%, coming from the sale of residential or other completed projects.
- Hotels: about 5% to 10%, including room revenue, food and beverage, and related hospitality services.
- Logistics and investment activities: a small remaining share, depending on the year.
This mix matters because rental income is generally steadier than property sales, while development income and valuation changes can create sharp swings in accounting profit. Over the last several years, revenue has stayed around the same broad range, but profit has moved much more dramatically as property markets and revaluation effects changed.
The company’s cost structure also shows that its properties can still produce strong gross profit even when bottom-line earnings weaken. The main pressure points have come from lower property valuations, softer operating profit, and interest expense rather than from a collapse in gross rental economics.
A useful takeaway from the operating flow is that revenue has been relatively resilient, but net income has been far less stable. That gap is common in property companies with large asset bases, where market valuation adjustments and financing costs can heavily influence reported earnings.
Key Figures
| Metric | Value | Sector ⓘ |
|---|---|---|
| Date | Oct 17, 2026 | |
| Context | ||
| Sector | Real Estate | |
| Industry | Real Estate Services | |
| Market Cap ⓘ | $12.60B | |
| Beta ⓘ | 0.85 | |
Value (Cheapness) | ||
| P/E Ratio ⓘ | N/A | 17.38 |
| P/B Ratio ⓘ | 0.01 | 0.85 |
| FCF Yield ⓘ | 97.94% | 7.38% |
| Dividend Yield ⓘ | 38.55% | 4.85% |
| EBIT / EV ⓘ | N/A | 3.78% |
| PEG ⓘ | 0.17 | |
Growth (Business expansion) | ||
| Revenue Growth ⓘ | -1.00% | 5.30% |
| RPS Growth (5Y CAGR) ⓘ | 57.90% | 6.02% |
| EPS Growth (5Y CAGR) ⓘ | -54.90% | -11.37% |
| BVPS Growth (5Y CAGR) ⓘ | 60.87% | 0.45% |
| Margin Growth (5Y Trend) ⓘ | -54.57% | -0.22% |
| FCF Growth (5Y CAGR) ⓘ | -3.55% | 5.40% |
| DPS Growth (5Y CAGR) ⓘ | 63.88% | 5.02% |
Quality (Business durability) | ||
| ROIC (Latest) ⓘ | N/A | 5.69% |
| ROE (Latest) ⓘ | -1.37% | 7.56% |
| ROA (Latest) ⓘ | -1.07% | 2.85% |
| ROIC (5Y Median) ⓘ | 0.09% | 4.22% |
| ROE (5Y Median) ⓘ | 0.48% | 6.03% |
| ROA (5Y Median) ⓘ | 0.37% | 2.44% |
| Net Debt / EBIT (Latest) ⓘ | 6.87 | 7.59 |
| Net Debt / EBIT (5Y Median) ⓘ | N/A | 8.40 |
| Net Debt / EBITDA (Latest) ⓘ | 6.19 | 5.27 |
| Net Debt / Assets ⓘ | 12.97% | 37.76% |
| EBITDA / Interest ⓘ | 1.16 | 4.10 |
| Operating Margin (Latest) ⓘ | 16.62% | 35.29% |
| Operating Margin (5Y Median) ⓘ | 31.58% | 37.31% |
| Debt to Equity (Latest) ⓘ | 17.35% | 88.87% |
| Profit Margin (Latest) ⓘ | -15.90% | 19.61% |
| Free Cash Flow (Latest) ⓘ | $12.34B | |
Momentum (Price trend) | ||
| 3Y Return ⓘ | +27.59% | +30.75% |
| 12M Return (excl. last month) ⓘ | +38.39% | +4.36% |
| 6M Return ⓘ | +39.87% | -2.52% |
| Price vs. 200-Day MA ⓘ | +38.35% | -2.34% |
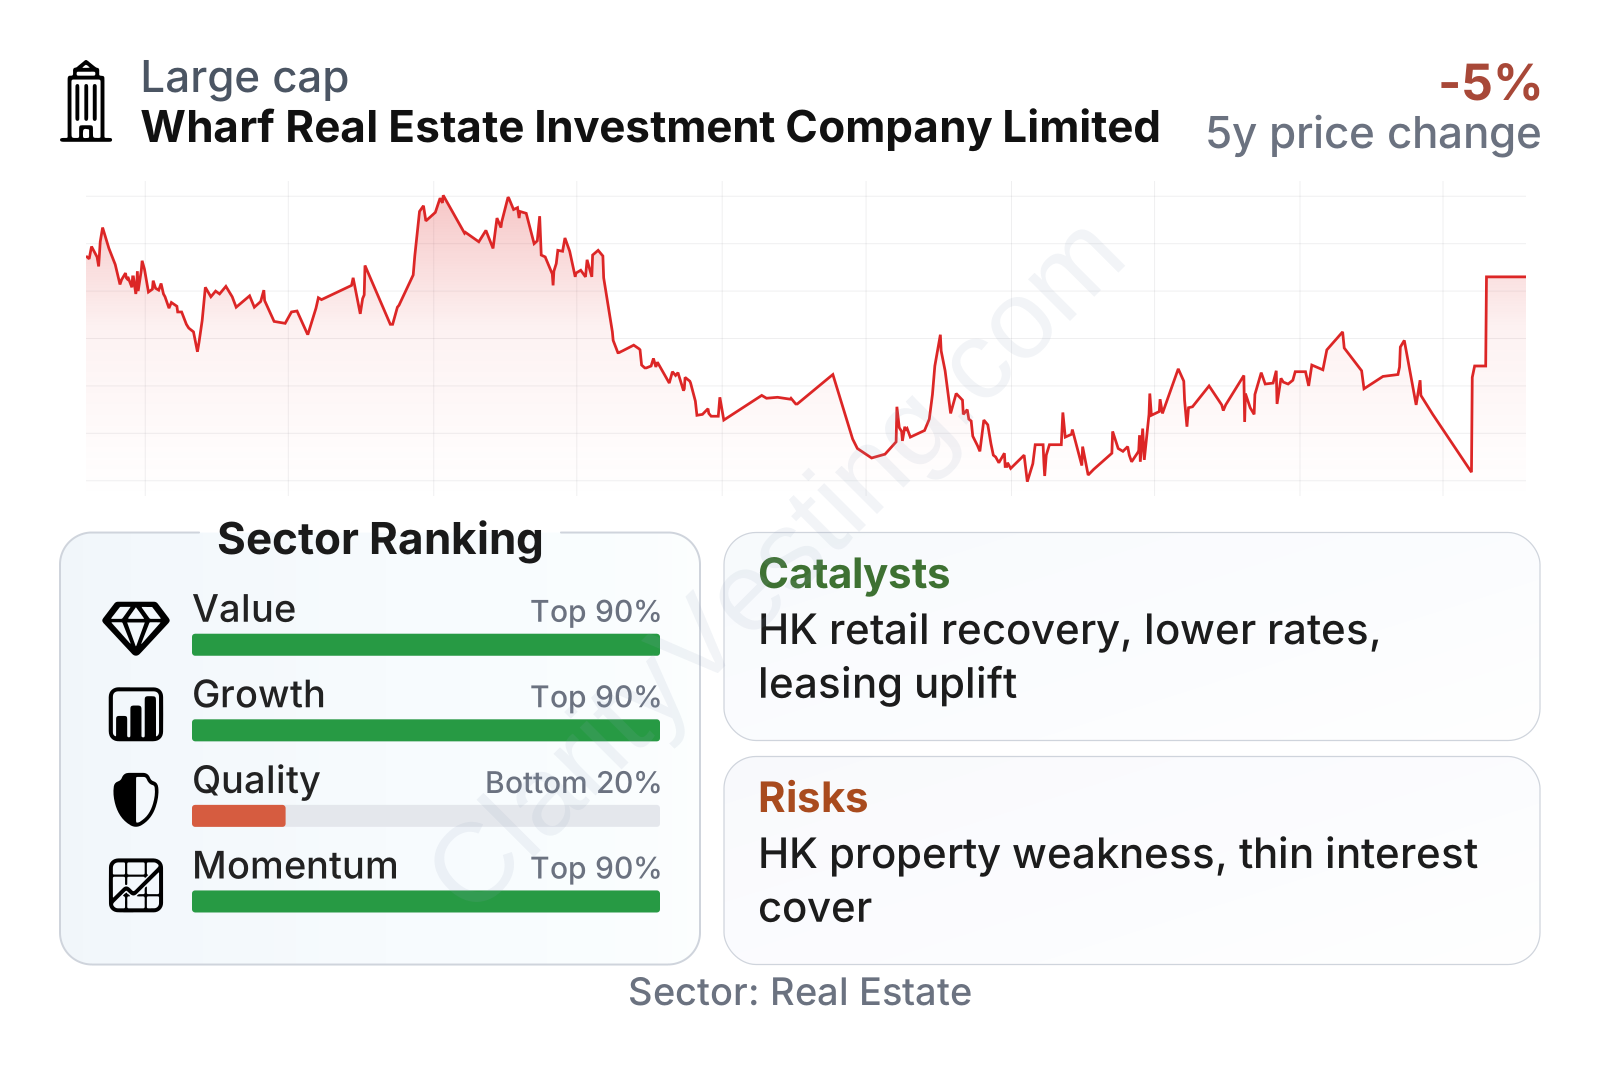
The overall profile is unusual. On value and market momentum, the company ranks very strongly relative to much of the real estate sector. On quality, it ranks weakly, mainly because recent profitability ratios are negative or very low. Balance sheet leverage looks moderate on a debt-to-equity basis, but interest coverage is thin, which means financing costs deserve close attention even if asset-backed leverage does not look extreme.
The share price history also reflects this mixed picture: the stock has been volatile over the last several years, with a deep decline followed by a meaningful rebound. That pattern often appears when the market is reassessing whether property values and rental conditions have stabilized.
Growth
Wharf REIC operates in a sector with long-term relevance but uneven near-term growth. Prime urban retail and mixed-use real estate in Hong Kong can remain valuable for decades, especially when assets are hard to replicate. However, the sector is currently shaped by slower office demand, changing retail habits, tourism recovery patterns, and pressure on commercial property valuations across higher-rate environments.
The company’s strategy still makes industrial sense: own trophy assets in dense, supply-constrained districts, keep occupancy and tenant quality high, refresh malls and commercial spaces, and use those properties to generate recurring cash flow. This is not a rapid expansion model. It is closer to an asset-optimization model built around premium locations.
Revenue per share has been uneven rather than steadily compounding. That fits the nature of a property business exposed to tenant demand, hotel cycles, and development timing. Even so, the company’s landmark asset base gives it a platform that many smaller peers cannot match, particularly if Hong Kong retail traffic and premium leasing demand continue to normalize.
Dividend patterns also show why readers should separate operating cash generation from accounting earnings swings. The historical distribution record suggests the company has remained capable of returning substantial cash at times, though property companies can show large fluctuations when asset sales, valuation movements, or special distributions affect the numbers.
One of the clearest catalysts is a continued recovery in spending and visitor activity in Hong Kong’s prime retail districts. Harbour City and Times Square are not ordinary assets; they are destination properties with strong tenant appeal. If tenant sales improve and leasing spreads become more favorable, earnings quality could improve even without major new developments. Another possible support is lower financing pressure if interest rates ease or debt is refinanced on better terms.
Recent company communications have also centered on portfolio resilience, leasing, and asset management rather than aggressive expansion. In the current environment, that conservative approach may be more sensible than pursuing growth through heavy new investment.
Risks
This article is for informational purposes only and does not constitute financial advice. Some content is AI-generated. See Disclaimer


