Stock Analysis · Warby Parker Inc (WRBY)
Overview
Warby Parker Inc is an eyewear company that sells prescription glasses, sunglasses, contact lenses, eye exams, and related vision services. The brand built its reputation by combining stylish frames, lower prices than many traditional optical chains, and a direct relationship with customers through its website and its own stores. Over time, it has evolved from a mostly online glasses seller into a broader vision-care platform with retail locations, telehealth features, and in-person eye care.
Its revenue still comes overwhelmingly from selling products to customers, with eyewear representing the core of the business. Based on company disclosures, the revenue mix is best understood as follows:
- Prescription glasses and non-prescription eyewear: approximately 75% to 85% of revenue. This includes optical frames, prescription lenses, blue-light lenses, and sunglasses sold through stores and online.
- Contact lenses: approximately 10% to 20% of revenue. This category has become a useful repeat-purchase business because customers reorder more frequently than they replace glasses.
- Eye exams and other vision services: approximately 3% to 8% of revenue. This includes comprehensive eye exams and related professional services offered in stores where licensed optometrists are available.
Warby Parker does not report a detailed revenue split by every product line each quarter, so these percentages are directional rather than exact. What is clear is that glasses remain the main economic engine, while contacts and services support customer retention and encourage recurring visits.
The business model is also increasingly omnichannel. Customers can browse online, try frames at home, visit a store for fittings or exams, and then reorder digitally. That combination matters because eyewear is both a medical need and a consumer product, and many shoppers still prefer some level of physical interaction before purchasing.
From a financial flow perspective, the company has grown revenue steadily over the last several years, gross profit has expanded with it, and losses have narrowed sharply. The biggest pressure point has been operating expenses, especially selling, general, and administrative costs, which have absorbed much of the gross profit as Warby Parker invested in stores, marketing, technology, and staffing.
Key Figures
| Metric | Value | Sector ⓘ |
|---|---|---|
| Date | Oct 24, 2026 | |
| Context | ||
| Sector | Healthcare | |
| Industry | Medical Instruments & Supplies | |
| Market Cap ⓘ | $3.17B | |
| Beta ⓘ | 1.90 | |
Value (Cheapness) | ||
| P/E Ratio ⓘ | 427.17 | 25.42 |
| P/B Ratio ⓘ | 8.23 | 3.08 |
| FCF Yield ⓘ | 0.69% | 3.12% |
| Dividend Yield ⓘ | N/A | 1.85% |
| EBIT / EV ⓘ | 0.35% | 0.56% |
| PEG ⓘ | N/A | |
Growth (Business expansion) | ||
| Revenue Growth ⓘ | 9.80% | 7.50% |
| RPS Growth (5Y CAGR) ⓘ | 10.00% | 8.60% |
| EPS Growth (5Y CAGR) ⓘ | N/A | -17.73% |
| BVPS Growth (5Y CAGR) ⓘ | 3.95% | 3.72% |
| Margin Growth (5Y Trend) ⓘ | N/A | -0.57% |
| FCF Growth (5Y CAGR) ⓘ | N/A | 0.96% |
| DPS Growth (5Y CAGR) ⓘ | N/A | 6.69% |
Quality (Business durability) | ||
| ROIC (Latest) ⓘ | 2.58% | 3.17% |
| ROA (Latest) ⓘ | 1.05% | 2.98% |
| ROIC (5Y Median) ⓘ | -16.64% | 4.56% |
| ROA (5Y Median) ⓘ | -11.00% | 1.87% |
| Net Debt / EBIT (Latest) ⓘ | -4.21 | 1.34 |
| Net Debt / EBIT (5Y Median) ⓘ | N/A | 1.86 |
| Net Debt / EBITDA (Latest) ⓘ | -0.66 | 1.00 |
| Net Debt / Assets ⓘ | -5.40% | 5.06% |
| EBITDA / Interest ⓘ | N/A | 9.55 |
| Operating Margin (Latest) ⓘ | 1.09% | 9.25% |
| Operating Margin (5Y Median) ⓘ | -9.37% | 7.33% |
| Debt to Equity (Latest) ⓘ | 64.03% | 26.68% |
| Profit Margin (Latest) ⓘ | 0.85% | 3.34% |
| Free Cash Flow (Latest) ⓘ | $21.75M | |
Momentum (Price trend) | ||
| 3Y Return ⓘ | +85.34% | +51.61% |
| 12M Return (excl. last month) ⓘ | -19.68% | +19.90% |
| 6M Return ⓘ | +4.43% | +10.10% |
| Price vs. 200-Day MA ⓘ | +1.65% | +6.44% |
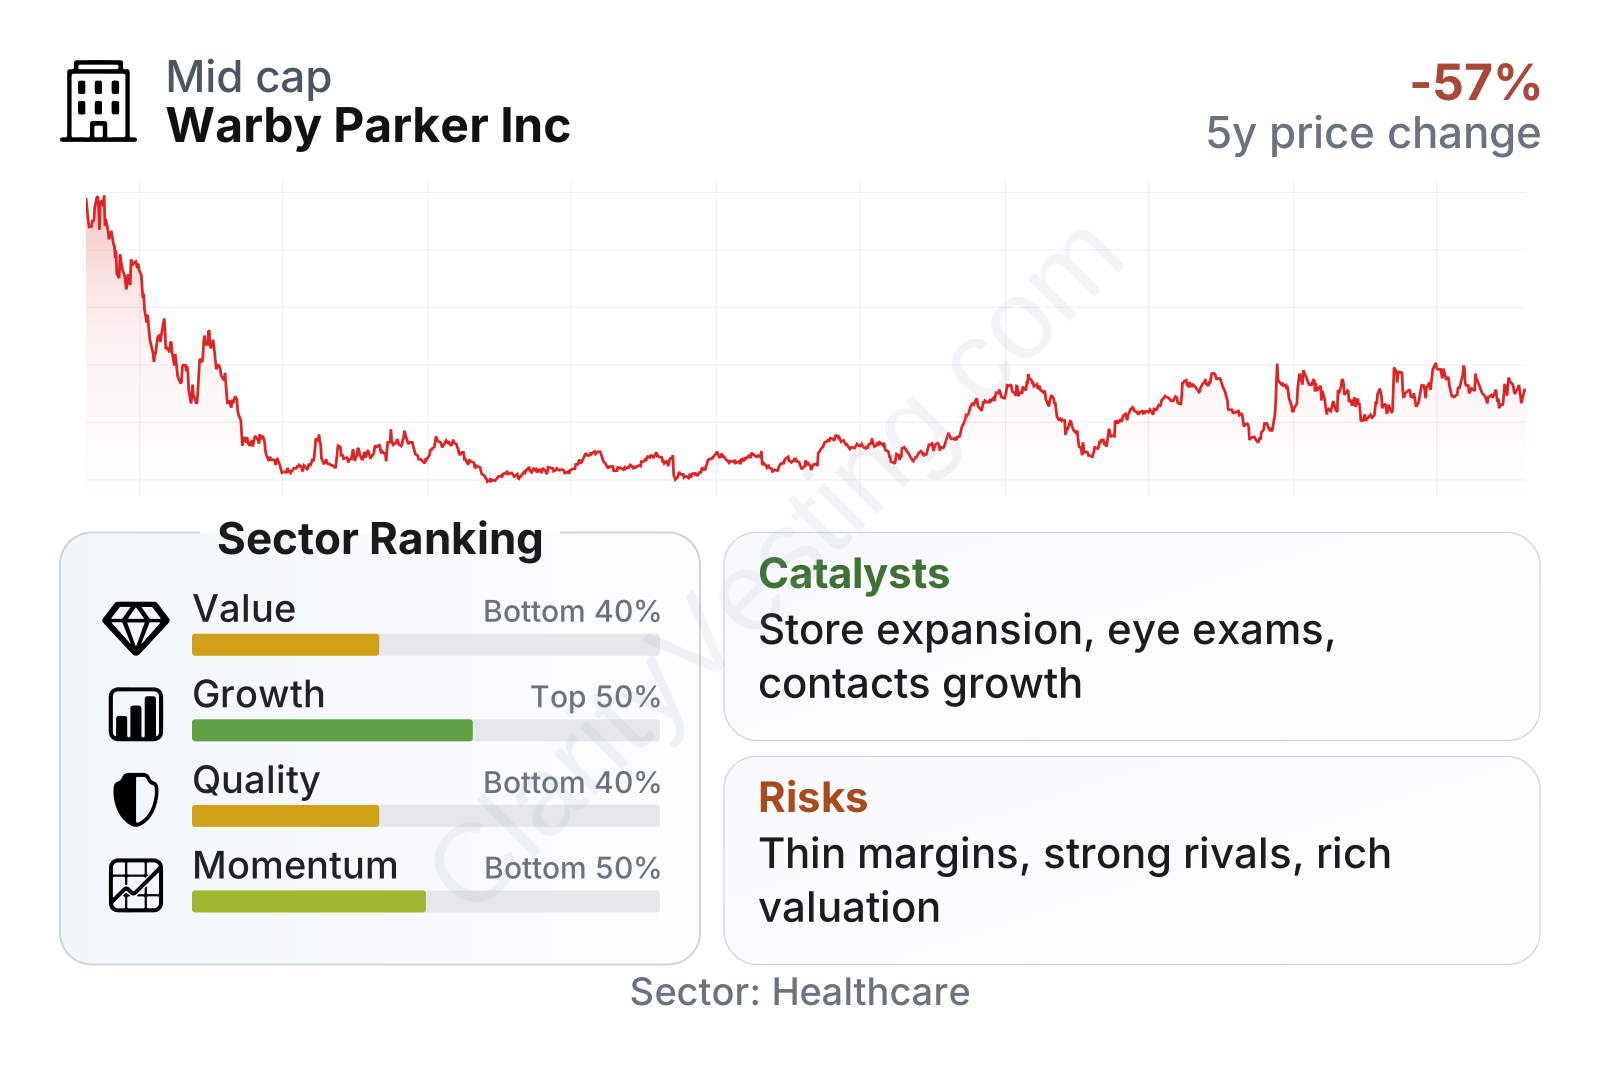
Warby Parker sits in the small-to-mid cap range and its stock has been volatile, with a beta near 1.9. The share price fell sharply after the 2021 listing, then recovered in stages as the company moved closer to breakeven and positive cash generation. On the factor view, growth looks stronger than the sector median, while quality and valuation metrics are less favorable. That combination fits a business that is improving operationally but is still early in proving durable profitability.
Growth
Warby Parker operates in a market with long-term structural support. Vision correction is not a discretionary category in the same way as many consumer products. People need glasses and contact lenses regularly, and an aging population can support demand for vision care over time. The company also sits at the intersection of healthcare and consumer retail, which gives it more than one path to expand: more customers, more products per customer, and more services around each customer relationship.
Its strategy for growth is fairly coherent. Management has been expanding the store base, using physical locations not just as sales points but also as customer acquisition centers and service hubs. In eyewear, stores matter because fit, comfort, lens options, and eye exams are easier to explain and complete in person. That can improve conversion and reduce some of the friction of buying prescription products online. At the same time, Warby Parker keeps the convenience of digital ordering and reordering, especially for contacts.
Recent revenue trends suggest the model is still expanding at a healthy pace. Year-over-year growth has generally stayed around high single digits to mid-teens, which is above the sector median in the latest metrics. That is important because the company is no longer just growing off a small base from its early years; it is showing continued demand even as the business has become much larger.
Another encouraging sign is cash generation. Warby Parker moved from clearly negative free cash flow a few years ago to positive free cash flow more recently. That does not mean the business has reached mature profitability, but it does indicate that operations are becoming more self-funding.
The strongest near-term catalysts are tied to operating leverage and ecosystem expansion. If store productivity improves, if eye exams drive higher attachment of eyewear sales, and if contact lens customers continue to reorder regularly, revenue can keep rising without costs increasing at the same pace. The company has also been pushing deeper into vision services, which can make the brand more useful to customers than a simple frame seller.
Recent company updates have also highlighted continued store openings and steady customer growth. That matters because the store base can widen brand reach in markets where online-only awareness has natural limits. In a category where trust and convenience are important, each new location can support both local sales and broader brand visibility.
Risks
This article is for informational purposes only and does not constitute financial advice. Some content is AI-generated. See Disclaimer


