Stock Analysis · W. R. Berkley Corp (WRB)
Overview
W. R. Berkley is a property and casualty insurer. In simple terms, it sells insurance policies that protect businesses and individuals against losses, and it also earns income by investing the premiums it holds before claims are paid. The company is known for operating through many specialized insurance units rather than relying on one broad mass-market brand. That structure lets it focus on narrower areas where underwriting discipline and expertise can matter more than scale alone.
The business is organized mainly into two operating segments: Insurance and Reinsurance & Monoline Excess. Insurance is the core engine, covering a wide range of commercial risks through admitted and excess-and-surplus lines. Reinsurance & Monoline Excess includes treaty and facultative reinsurance as well as certain excess and specialty lines. A meaningful part of overall earnings also comes from investment income, which is important for insurers because they invest bond portfolios funded by policyholder premiums.
Using the company’s recent annual reporting structure, the main revenue sources can be summarized as follows:
- Insurance premiums and related underwriting revenue: about 85% to 90%. This is the largest source and includes commercial property, casualty, professional liability, workers’ compensation, excess and surplus lines, and other specialty coverages written through the Insurance segment.
- Reinsurance and monoline excess business: about 8% to 12%. This includes reinsurance contracts and selected excess lines where the company takes on part of other insurers’ risks or writes specialized protection directly.
- Net investment income and other items: about 5% to 10% of total revenue, though the share can vary by period. This comes mainly from fixed-income investments and is especially relevant when interest rates are higher.
Over the last several years, total revenue has moved steadily higher, rising from roughly $9.5 billion in 2021 to about $14.7 billion in 2025. Net income also expanded over that span, although growth has not been perfectly linear because insurance results can shift with claims activity, pricing cycles, and catastrophe exposure. The broader picture is of a sizable specialty insurer that has compounded book value and earnings while maintaining a decentralized operating model.
The long-term pattern is clear: revenue and operating profit have both increased materially since 2021, while interest expense has stayed fairly contained. Net income has also risen strongly over that period, which suggests that growth has not come only from writing more business, but also from preserving underwriting discipline and benefiting from stronger investment income.
Key Figures
| Metric | Value | Sector ⓘ |
|---|---|---|
| Date | Oct 24, 2026 | |
| Context | ||
| Sector | Financial Services | |
| Industry | Insurance - Property & Casualty | |
| Market Cap ⓘ | $28.05B | |
| Beta ⓘ | 0.27 | |
Value (Cheapness) | ||
| P/E Ratio ⓘ | 15.97 | 12.46 |
| P/B Ratio ⓘ | 2.84 | 1.25 |
| FCF Yield ⓘ | 12.48% | 9.82% |
| Dividend Yield ⓘ | 0.12% | 2.94% |
| EBIT / EV ⓘ | 10.01% | 8.11% |
| PEG ⓘ | 4.45 | |
Growth (Business expansion) | ||
| Revenue Growth ⓘ | -0.80% | 9.10% |
| RPS Growth (5Y CAGR) ⓘ | 13.08% | 12.31% |
| EPS Growth (5Y CAGR) ⓘ | 6.83% | -6.97% |
| BVPS Growth (5Y CAGR) ⓘ | 11.30% | 5.02% |
| Margin Growth (5Y Trend) ⓘ | 1.23% | -4.00% |
| FCF Growth (5Y CAGR) ⓘ | 13.14% | 4.71% |
| DPS Growth (5Y CAGR) ⓘ | 19.94% | 8.92% |
Quality (Business durability) | ||
| ROIC (Latest) ⓘ | 16.15% | 9.18% |
| ROE (Latest) ⓘ | 19.29% | 13.93% |
| ROA (Latest) ⓘ | 4.15% | 1.57% |
| ROIC (5Y Median) ⓘ | 15.28% | 7.80% |
| ROE (5Y Median) ⓘ | 19.69% | 12.15% |
| ROA (5Y Median) ⓘ | 4.19% | 1.28% |
| Net Debt / EBIT (Latest) ⓘ | 0.22 | 1.02 |
| Net Debt / EBIT (5Y Median) ⓘ | 0.75 | 0.72 |
| Net Debt / EBITDA (Latest) ⓘ | 0.22 | 0.88 |
| Operating Margin (Latest) ⓘ | 14.10% | 22.30% |
| Operating Margin (5Y Median) ⓘ | 16.35% | 24.50% |
| Debt to Equity (Latest) ⓘ | 27.84% | 59.34% |
| Profit Margin (Latest) ⓘ | 12.53% | 26.42% |
| Free Cash Flow (Latest) ⓘ | $3.50B | |
Momentum (Price trend) | ||
| 3Y Return ⓘ | +93.47% | +95.73% |
| 12M Return (excl. last month) ⓘ | -4.55% | +17.30% |
| 6M Return ⓘ | +13.10% | +6.07% |
| Price vs. 200-Day MA ⓘ | +10.05% | +5.36% |
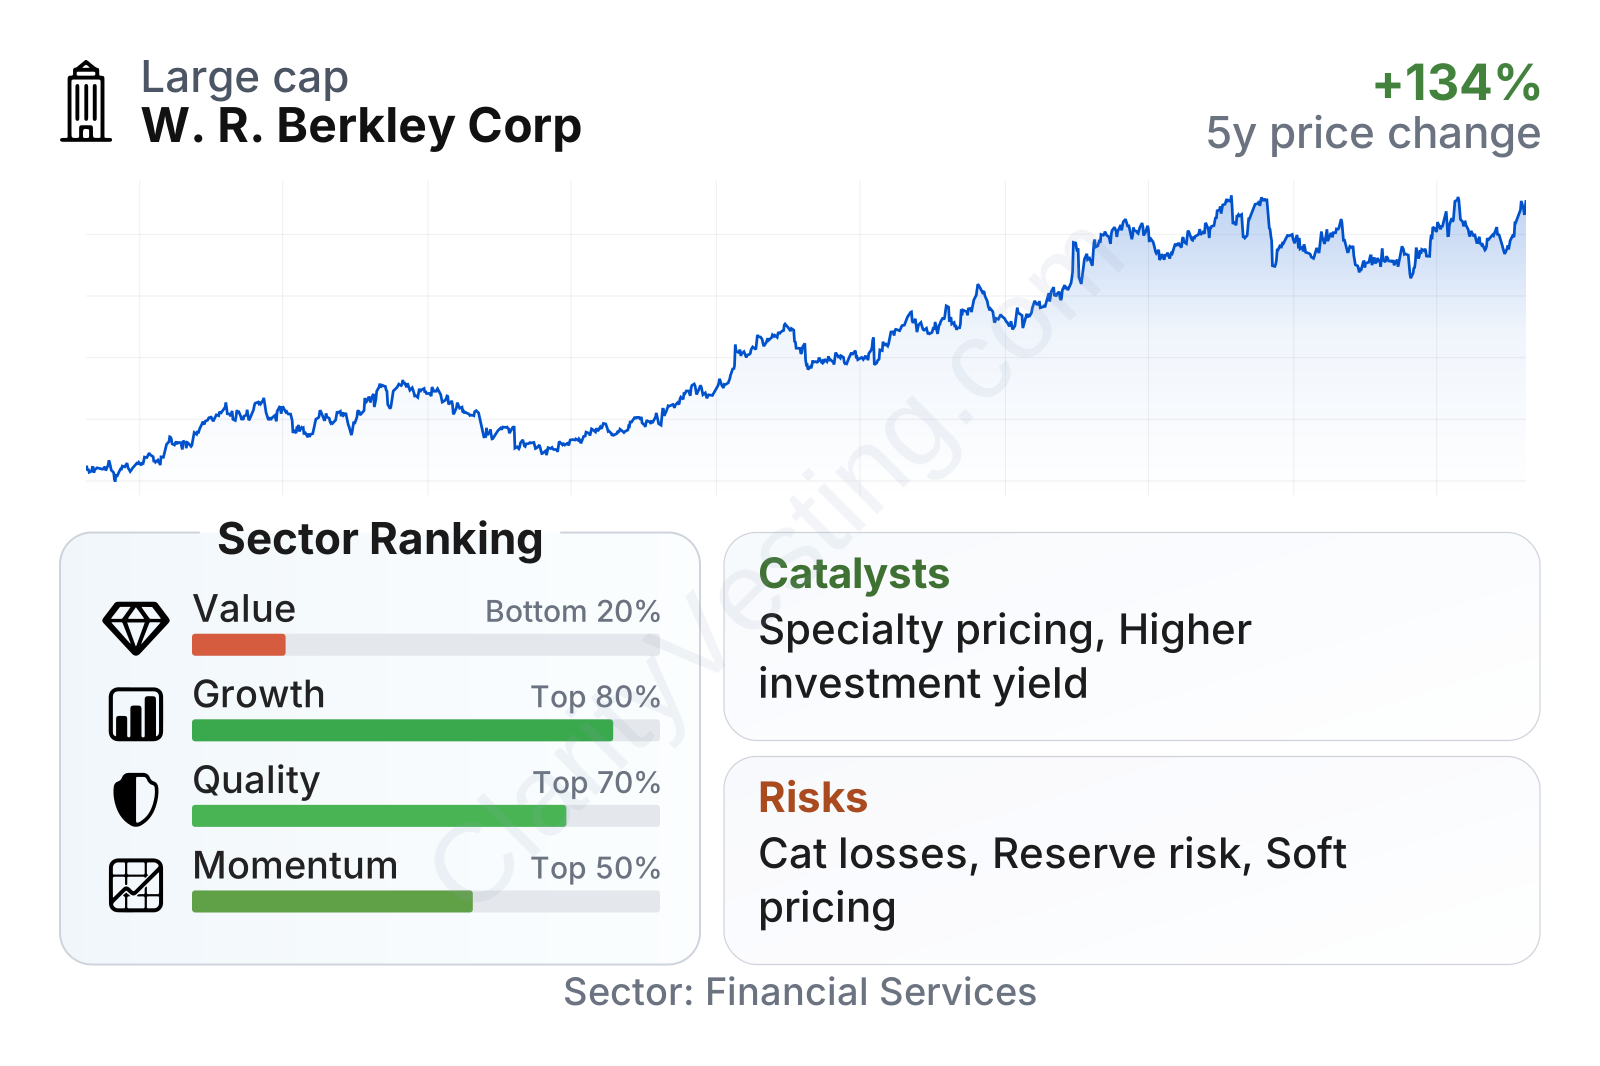
W. R. Berkley stands out more for quality and consistency than for low headline valuation multiples. It is a large insurer with unusually low share-price volatility, as shown by its very low beta. Profitability measures are strong relative to the sector, with returns on equity, assets, and invested capital comfortably above median levels, while leverage remains conservative. Growth indicators are also favorable over a five-year view, especially for revenue per share, book value per share, free cash flow, and dividends. The weaker area is valuation: the shares trade above sector median levels on both earnings and book value, which means the market is already recognizing much of that quality.
Growth
Property and casualty insurance is not a rapid-growth sector in the way software or semiconductors can be, but it is a large and durable market with recurring demand. Businesses need coverage regardless of the economic cycle, and pricing can improve meaningfully when industry losses increase or underwriting capital becomes more selective. That is especially important for specialty insurers like W. R. Berkley, because they often operate in niches where price increases can be stronger and underwriting terms can tighten faster than in more commoditized insurance lines.
The company’s strategy appears coherent for long-term expansion. Its model relies on many specialized operating units with local decision-making, which can help it enter new niches, adapt pricing quickly, and stay disciplined when market conditions change. That decentralized approach has been a core feature of the group for years. It also supports acquisitions and new business launches, because management can add focused teams without having to rebuild the entire organization around them.
Another growth support is investment income. Insurers collect premiums before paying claims, creating investable assets known as float. In a higher-rate environment, that float becomes more valuable because new money can be invested at better yields. For W. R. Berkley, that matters because underwriting profits and investment income can reinforce each other when both are healthy.
Earnings per share have risen strongly since 2021, moving from the low-$2 range to above $4 by 2025, with 2026 year-to-date levels still pointing to solid profitability. That kind of progression is notable in insurance, where results often swing more sharply. It suggests the company has been able to combine pricing strength, underwriting execution, and investment income support over several years.
Book value per share has also compounded at a healthy pace, rising from around $16 in 2021 to above $24 by 2025. For insurers, book value is an important marker because it reflects the capital base supporting future underwriting. Growth here is particularly relevant: it shows that profits have not simply been distributed away, but have also added to the company’s underlying economic value.
A meaningful recent catalyst is the continued strength of specialty commercial pricing in selected lines, together with the company’s ability to expand where returns remain attractive rather than chase volume everywhere. Public company updates in 2026 also indicate ongoing premium growth and continued benefit from investment yields, even if quarterly comparisons can move around. In addition, Berkley has kept building out selected operating units over time, which can create incremental opportunities without requiring a major change in strategy.
Risks
This article is for informational purposes only and does not constitute financial advice. Some content is AI-generated. See Disclaimer


