Stock Analysis · W P Carey Inc (WPC)
Overview
W. P. Carey is a diversified real estate investment trust, or REIT. In simple terms, it owns commercial properties and collects rent from tenants. Its specialty is the net-lease model, where tenants usually pay not only rent but also many property-level costs such as maintenance, insurance, and taxes. That structure can make cash flow steadier than in some other property businesses.
The company owns properties across the United States and parts of Europe, with a portfolio spread across industrial, warehouse, retail, self-storage, office, and other specialty assets. A major feature of W. P. Carey’s business is long lease terms and built-in rent escalations, which are designed to support gradual income growth over time. The portfolio is also broadly diversified by tenant, property type, and geography, which reduces dependence on any single building or customer.
Its revenue comes primarily from rental income generated by owned real estate. Based on the company’s recent portfolio disclosures, the largest property categories are approximately:
- Industrial: about 35% of annual base rent. This includes manufacturing and production-related facilities.
- Warehouse: about 28% of annual base rent. These properties support logistics, storage, and distribution activity.
- Retail: about 17% of annual base rent. This includes stores and consumer-facing real estate.
- Self-storage: about 6% of annual base rent. These properties serve household and business storage demand.
- Office: about 5% of annual base rent. This has become a smaller part of the portfolio after the company reduced exposure.
- Other: about 9% of annual base rent. This includes a mix of specialty property types.
Geographically, rent is still led by the United States, with Europe making up a meaningful secondary market. Another important point is lease structure: a very large majority of leases include contractual rent increases, many tied either to fixed annual bumps or inflation indexes. That matters because it gives W. P. Carey a built-in mechanism for revenue growth even without buying new properties.
Over the last several years, revenue and operating income have generally expanded, although net income has been more uneven. That is common in real estate, where asset sales, impairments, and financing costs can create swings in accounting earnings even when rent collection remains solid.
The overall picture is of a rent-driven business with strong gross profitability and relatively limited direct property operating costs. Interest expense has become a more important drag as borrowing costs moved higher, which is one of the main themes to watch in the current period.
Key Figures
| Metric | Value | Sector ⓘ |
|---|---|---|
| Date | Oct 03, 2026 | |
| Context | ||
| Sector | Real Estate | |
| Industry | REIT - Diversified | |
| Market Cap ⓘ | $14.72B | |
| Beta ⓘ | 0.77 | |
Value (Cheapness) | ||
| P/E Ratio ⓘ | 22.60 | 17.35 |
| P/B Ratio ⓘ | 1.68 | 0.86 |
| FCF Yield ⓘ | 7.35% | 7.47% |
| Dividend Yield ⓘ | 5.69% | 4.75% |
| EBIT / EV ⓘ | 3.53% | 3.81% |
| PEG ⓘ | 1.47 | |
Growth (Business expansion) | ||
| Revenue Growth ⓘ | 18.40% | 5.30% |
| RPS Growth (5Y CAGR) ⓘ | 3.00% | 5.96% |
| EPS Growth (5Y CAGR) ⓘ | -8.33% | -11.41% |
| BVPS Growth (5Y CAGR) ⓘ | -3.01% | 0.41% |
| Margin Growth (5Y Trend) ⓘ | -2.22% | 0.53% |
| FCF Growth (5Y CAGR) ⓘ | 4.17% | 5.40% |
| DPS Growth (5Y CAGR) ⓘ | -3.81% | 5.02% |
Quality (Business durability) | ||
| ROIC (Latest) ⓘ | 4.79% | 5.77% |
| ROE (Latest) ⓘ | 7.76% | 7.64% |
| ROA (Latest) ⓘ | 3.56% | 2.85% |
| ROIC (5Y Median) ⓘ | 4.48% | 4.20% |
| ROE (5Y Median) ⓘ | 5.67% | 6.03% |
| ROA (5Y Median) ⓘ | 2.72% | 2.45% |
| Net Debt / EBIT (Latest) ⓘ | 10.44 | 7.57 |
| Net Debt / EBIT (5Y Median) ⓘ | 10.57 | 8.41 |
| Net Debt / EBITDA (Latest) ⓘ | 6.35 | 5.12 |
| Net Debt / Assets ⓘ | 47.15% | 37.84% |
| EBITDA / Interest ⓘ | 4.49 | 4.11 |
| Operating Margin (Latest) ⓘ | 44.35% | 35.40% |
| Operating Margin (5Y Median) ⓘ | 48.59% | 36.59% |
| Debt to Equity (Latest) ⓘ | 103.19% | 89.06% |
| Profit Margin (Latest) ⓘ | 35.76% | 19.99% |
| Free Cash Flow (Latest) ⓘ | $1.08B | |
Momentum (Price trend) | ||
| 3Y Return ⓘ | +44.86% | +30.60% |
| 12M Return (excl. last month) ⓘ | +10.40% | +7.55% |
| 6M Return ⓘ | -5.46% | +0.69% |
| Price vs. 200-Day MA ⓘ | -7.53% | -2.30% |
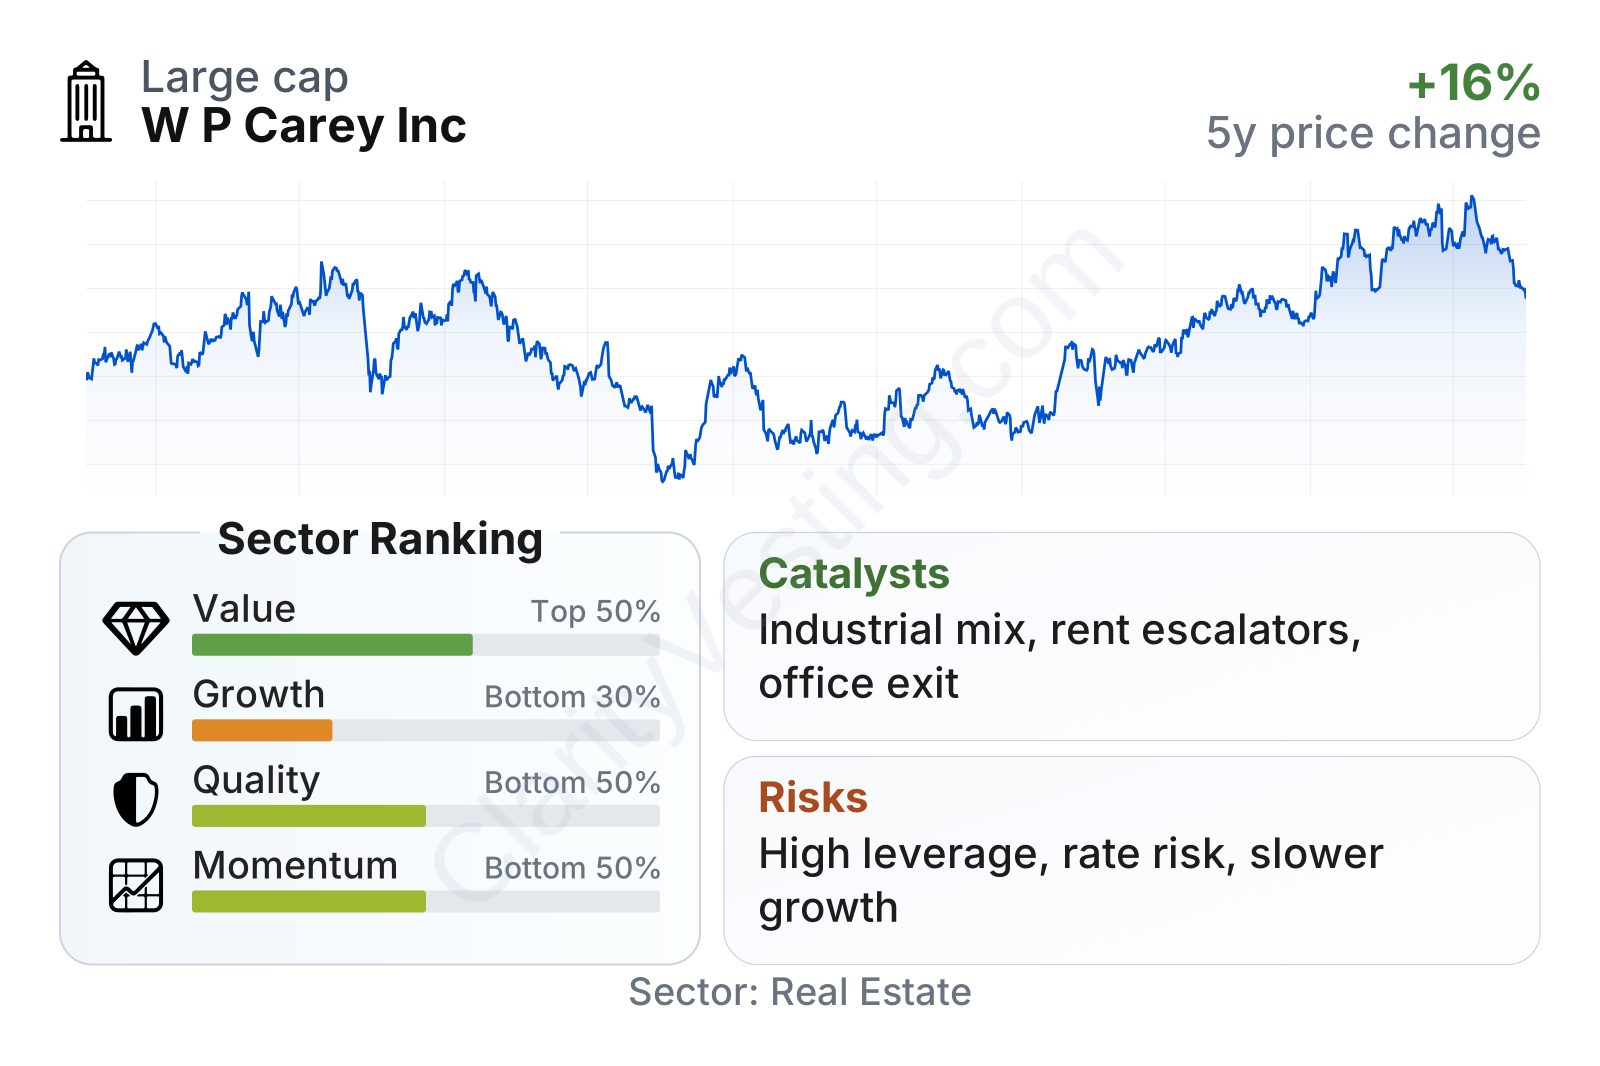
W. P. Carey sits in the middle of the real estate sector on value measures rather than looking clearly cheap. Its dividend yield is above the sector median, while free cash flow yield is roughly in line. Growth and momentum are weaker areas on a multi-year basis, while profitability is mixed: margins and asset returns are respectable, but leverage is heavier than many peers. The company is also a large-cap REIT with a below-market beta, which fits the profile of a steadier, income-oriented real estate name rather than a fast-growing one.
The share price history shows a period of volatility around 2023 and 2024, followed by a stronger recovery into 2025 and 2026. That pattern lines up with how the market has treated rate-sensitive REITs: pressure when rates moved up sharply, then improved sentiment as balance-sheet concerns became more manageable and portfolio repositioning progressed.
Growth
W. P. Carey operates in a sector that still has room for long-term expansion, especially in industrial, warehouse, and logistics-linked real estate. Those areas are supported by e-commerce infrastructure, supply-chain redesign, and tenant demand for mission-critical facilities. The company is less dependent on office real estate than in the past, and that shift is important because industrial and warehouse assets generally have stronger long-term demand drivers.
The company’s strategy is straightforward and sensible for a mature REIT: recycle capital out of less favored property types, focus on long-duration net leases, keep tenant diversification broad, and rely on built-in rent escalators to support internal growth. That is not a high-speed expansion model, but it can be durable if acquisitions remain disciplined and occupancy stays high.
Revenue per share has moved upward over the past five years, though not in a straight line. The dip after 2023 shows that portfolio changes can temporarily interrupt progress, but the broader trend still suggests a business that can rebuild income after strategic asset sales.
Dividend per share has been less stable because the company reset its payout after separating a large office portfolio. That decision reduced income for shareholders in the short run, but it also reflected a major portfolio cleanup. For long-term analysis, the key question is whether the new asset mix can support steadier growth from a healthier base rather than whether the old payout level can be restored quickly.
One of the clearest catalysts is the company’s emphasis on leases with contractual rent increases. In a business where many expenses are passed through to tenants, even modest annual rent growth can flow through efficiently. Another growth support is the company’s international reach, which gives it a broader opportunity set than many U.S.-only net-lease REITs.
A recent opportunity comes from the company’s portfolio reshaping after reducing office exposure. If management continues to redeploy capital into industrial, warehouse, and other operationally stronger categories, future growth could become more dependable and easier for the market to value. In a lower-rate or more stable-rate environment, that could also improve acquisition economics and financing flexibility.
Risks
This article is for informational purposes only and does not constitute financial advice. Some content is AI-generated. See Disclaimer


