Stock Analysis · Wendel (WNDLF)
Overview
Wendel is a French investment company listed in Paris and traded in the U.S. over the counter under the symbol WNDLF. Rather than operating a single industrial business, it owns controlling or significant stakes in several companies and also invests through private asset-management platforms. In practice, Wendel’s results come from the businesses it owns, the fees earned by its asset-management activities, and changes in the value of its investment portfolio.
Its portfolio is diversified across areas such as asset management, insurance brokerage, industrial services, and healthcare-related activities. Based on Wendel’s most recent public annual disclosures, revenue is mainly generated by its consolidated operating subsidiaries, with asset-management fees adding a smaller but strategically important stream because they are usually less capital-intensive and can scale with assets under management.
The main revenue contributors are approximately the following:
- Crisis prevention and detection services through Bureau Veritas-related exposure and other business services: a meaningful but indirect value driver for Wendel, although not always shown as direct fee revenue at the parent-company level.
- Insurance brokerage through ACAMS/Scalian-like service platforms and especially IK Partners exposure where applicable: recurring service-based income tied to client activity and policy placements.
- Asset management fees through Wendel’s private capital and third-party fund activities: management fees, and potentially performance-related income when conditions allow.
- Industrial and technology services from majority-owned subsidiaries: project-based and recurring service revenue in engineering, consulting, and specialized operations.
- Investment income and portfolio revaluation effects: this is economically important for shareholder value, but it is less predictable and can make reported earnings volatile from year to year.
Because Wendel is a holding company, its economic engine is better understood through net asset value growth, dividend flows from portfolio companies, exits, and capital recycling than through a single simple sales line. That is why changes in book value, debt, and portfolio mix matter more here than they would for a standard operating company.
The income profile shows a business that still produces solid operating income, but the path from revenue to net profit has become more uneven. Interest expense has grown over time, and net income has swung sharply, which highlights how portfolio valuation effects, financing costs, and one-off items can materially change the final result.
Key Figures
| Metric | Value | Sector ⓘ |
|---|---|---|
| Date | Oct 24, 2026 | |
| Context | ||
| Sector | Financial Services | |
| Industry | Asset Management | |
| Market Cap ⓘ | $3.35B | |
| Beta ⓘ | 1.03 | |
Value (Cheapness) | ||
| P/E Ratio ⓘ | N/A | 12.46 |
| P/B Ratio ⓘ | 3.05 | 1.25 |
| FCF Yield ⓘ | 83.20% | 9.82% |
| Dividend Yield ⓘ | 4.15% | 2.94% |
| EBIT / EV ⓘ | N/A | 8.11% |
| PEG ⓘ | N/A | |
Growth (Business expansion) | ||
| Revenue Growth ⓘ | 3.20% | 9.10% |
| RPS Growth (5Y CAGR) ⓘ | -4.73% | 12.31% |
| EPS Growth (5Y CAGR) ⓘ | N/A | -6.97% |
| BVPS Growth (5Y CAGR) ⓘ | -15.86% | 5.02% |
| Margin Growth (5Y Trend) ⓘ | 0.44% | -4.00% |
| FCF Growth (5Y CAGR) ⓘ | 6.08% | 4.71% |
| DPS Growth (5Y CAGR) ⓘ | 14.15% | 8.92% |
Quality (Business durability) | ||
| ROIC (Latest) ⓘ | 10.25% | 9.18% |
| ROE (Latest) ⓘ | 41.85% | 13.93% |
| ROA (Latest) ⓘ | 3.36% | 1.57% |
| ROIC (5Y Median) ⓘ | 6.13% | 7.80% |
| ROE (5Y Median) ⓘ | 32.67% | 12.15% |
| ROA (5Y Median) ⓘ | 1.93% | 1.28% |
| Net Debt / EBIT (Latest) ⓘ | 2.41 | 1.02 |
| Net Debt / EBIT (5Y Median) ⓘ | 3.94 | 0.72 |
| Net Debt / EBITDA (Latest) ⓘ | 1.39 | 0.88 |
| Operating Margin (Latest) ⓘ | 11.13% | 22.30% |
| Operating Margin (5Y Median) ⓘ | 11.16% | 24.50% |
| Debt to Equity (Latest) ⓘ | 183.13% | 59.34% |
| Profit Margin (Latest) ⓘ | -1.10% | 26.42% |
| Free Cash Flow (Latest) ⓘ | $2.79B | |
Momentum (Price trend) | ||
| 3Y Return ⓘ | +36.68% | +95.73% |
| 12M Return (excl. last month) ⓘ | +9.78% | +17.30% |
| 6M Return ⓘ | +3.81% | +6.07% |
| Price vs. 200-Day MA ⓘ | -0.61% | +5.36% |
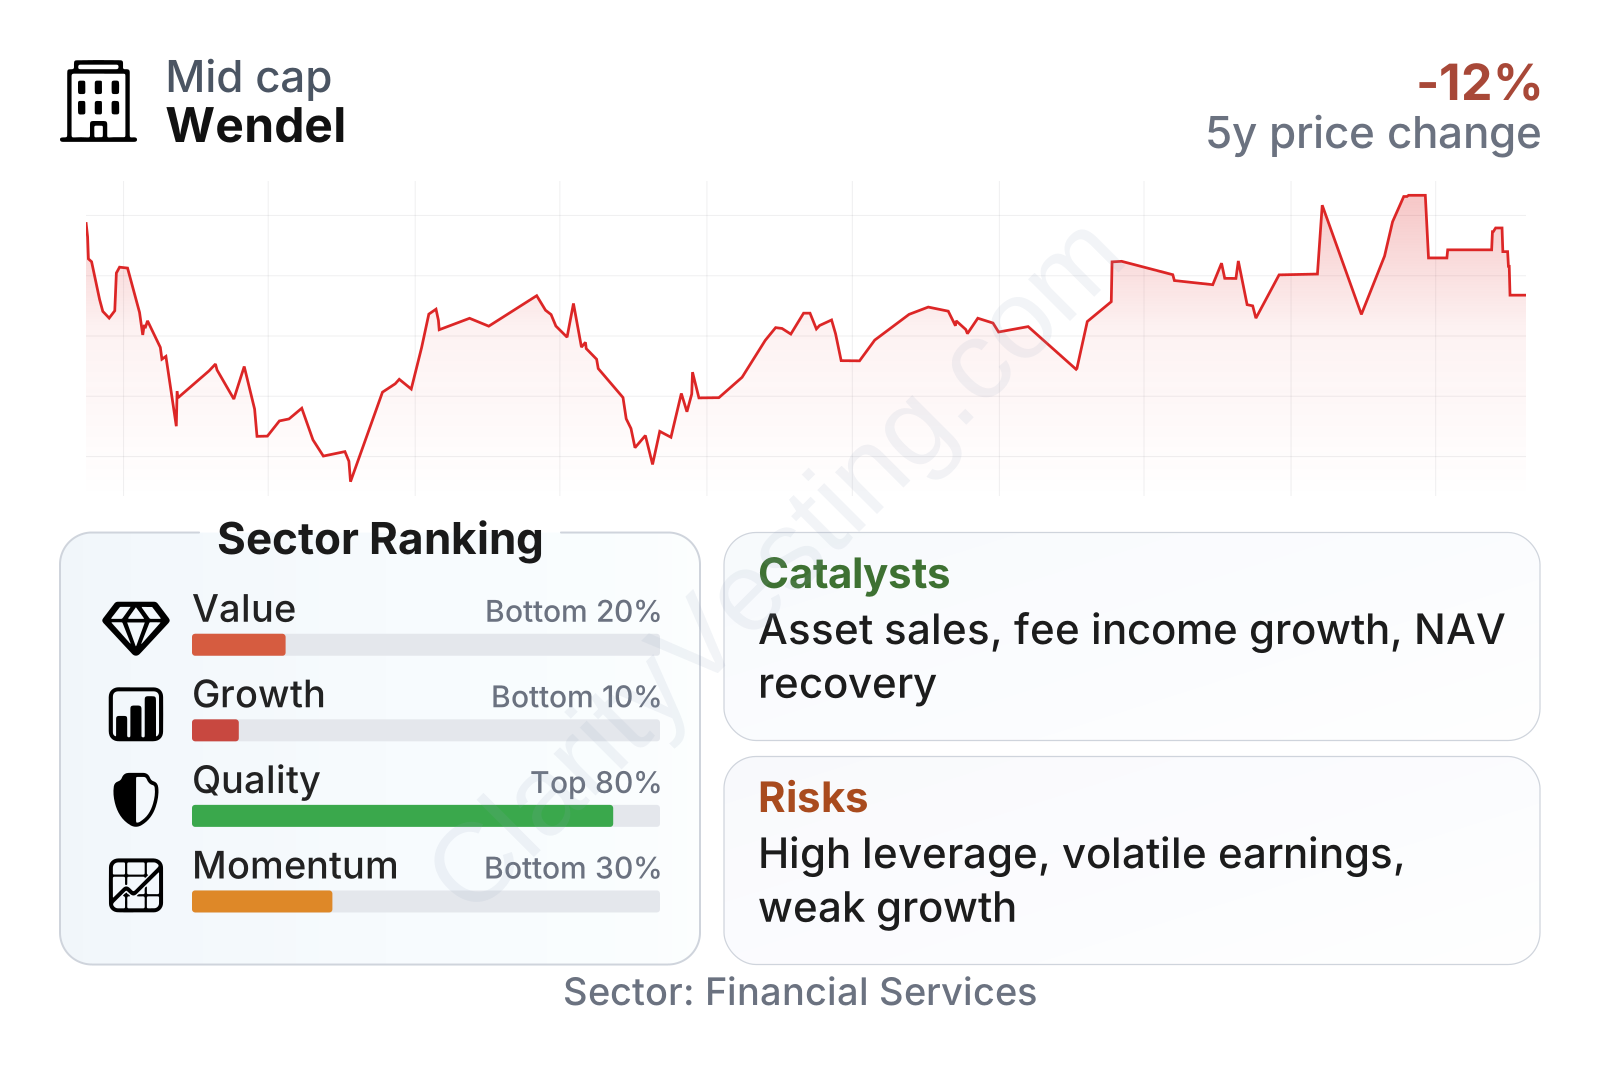
Wendel sits in the mid-sized range by market value and shows a share-price pattern that has recovered from earlier lows but has not matched the broader strength seen in many financial stocks over the last few years. The factor mix is unusual: profitability metrics such as return on equity and return on assets look strong relative to much of the sector, while growth ranks weakly and leverage is clearly higher than the sector median. The table also points to a high free-cash-flow yield and a dividend yield above the sector median, but those positives need to be read alongside volatile earnings and a premium book-value multiple.
Growth
Wendel operates in a part of financial services that can benefit from long-term growth in private markets, outsourced investment management, and demand for specialized service businesses. That backdrop is attractive because large institutional and wealthy clients continue to allocate capital toward private equity, private credit, and alternative asset platforms. For Wendel, that creates two possible growth paths at once: expansion in the value of its owned portfolio companies, and growth in recurring fee streams from third-party capital management.
The strategy broadly makes sense for future growth if management continues shifting the group toward activities that are less dependent on pure balance-sheet investing. Asset management can improve the model because fee income usually requires less capital than buying businesses outright. At the same time, Wendel’s long history and reputation in European private capital can help it source deals, partnerships, and exits that smaller platforms may struggle to access.
Recent company communications have emphasized portfolio rotation, development of asset-management capabilities, and selective capital deployment. Those are important because the most significant catalyst for a holding company is often not raw revenue growth but the ability to unlock value by selling mature assets, reinvesting at better returns, and narrowing any discount between market price and underlying portfolio value.
Book value per share has been volatile and remains below earlier levels, which shows that value creation has not followed a smooth upward line. Even so, the rebound after the sharp drop suggests that portfolio reshaping and valuation recovery have had some effect. For a company like Wendel, durable improvement in book value is one of the clearest signs that strategy execution is translating into long-term economic progress.
Another supportive point is that free cash flow has grown faster than the sector median over five years, and dividend growth has also been strong. That combination suggests Wendel has retained some financial flexibility despite uneven accounting profit. If portfolio exits, fundraising, or operating improvements in subsidiaries continue, those could become meaningful catalysts over the next few years.
Risks
This article is for informational purposes only and does not constitute financial advice. Some content is AI-generated. See Disclaimer


