Stock Analysis · Walmart Inc (WMT)
Overview
Walmart Inc. is the world’s largest retailer by revenue. It operates a broad network of stores and digital platforms that sell groceries, household goods, health and wellness products, apparel, electronics, and general merchandise. Its business is built around everyday low prices, very high sales volume, and an enormous supply chain that helps it keep products moving efficiently across stores, clubs, and e-commerce channels.
For long-term analysis, Walmart is best understood as a large-scale retail ecosystem rather than only a traditional discount chain. The company combines physical stores, online ordering, curbside pickup, delivery, membership programs, pharmacy, advertising, and third-party marketplace services. That mix matters because it gives Walmart several ways to grow beyond simply opening more stores.
Based on Walmart’s latest annual reporting for fiscal 2026, revenue is mainly generated from the following sources:
- Walmart U.S.: about 69% of total revenue. This includes U.S. stores and digital sales under the Walmart brand, with groceries representing the largest traffic driver.
- Walmart International: about 18% of total revenue. This segment includes retail and e-commerce operations in markets such as Mexico, Canada, China, and other countries where Walmart has controlling interests.
- Sam’s Club: about 13% of total revenue. This warehouse club business includes merchandise sales and membership income.
There is also a smaller but strategically important layer inside these segments: e-commerce, marketplace services, advertising, and membership-related income. These activities are not yet the main revenue base, but they tend to carry better economics than core retail and are becoming more relevant to future profit growth.
Walmart’s financial structure also shows a business with massive scale but naturally thin retail margins. Revenue has continued to rise steadily over the last several years, while gross profit and operating income have also expanded. That combination suggests Walmart is not only getting bigger, but is also improving execution in areas such as mix, logistics, and higher-margin services.
The visual flow highlights a familiar Walmart pattern: extremely large revenue, high merchandise costs, and relatively modest final profit margins. What stands out positively is that operating income and net income have grown faster than sales since fiscal 2023, showing that scale and mix improvements are contributing more meaningfully to earnings.
Key Figures
| Metric | Value | Sector ⓘ |
|---|---|---|
| Date | Oct 24, 2026 | |
| Context | ||
| Sector | Consumer Defensive | |
| Industry | Discount Stores | |
| Market Cap ⓘ | $944.62B | |
| Beta ⓘ | 0.58 | |
Value (Cheapness) | ||
| P/E Ratio ⓘ | 43.01 | 18.68 |
| P/B Ratio ⓘ | 10.26 | 1.24 |
| FCF Yield ⓘ | 1.43% | 12.11% |
| Dividend Yield ⓘ | 0.81% | 2.67% |
| EBIT / EV ⓘ | 3.37% | 6.40% |
| PEG ⓘ | 4.22 | |
Growth (Business expansion) | ||
| Revenue Growth ⓘ | 5.90% | 4.10% |
| RPS Growth (5Y CAGR) ⓘ | 6.91% | 6.22% |
| EPS Growth (5Y CAGR) ⓘ | 0.79% | -13.59% |
| BVPS Growth (5Y CAGR) ⓘ | 4.06% | 3.27% |
| Margin Growth (5Y Trend) ⓘ | 0.91% | -0.13% |
| FCF Growth (5Y CAGR) ⓘ | 7.74% | 4.10% |
| DPS Growth (5Y CAGR) ⓘ | 6.37% | 6.83% |
Quality (Business durability) | ||
| ROIC (Latest) ⓘ | 16.71% | 12.34% |
| ROA (Latest) ⓘ | 7.58% | 6.30% |
| ROIC (5Y Median) ⓘ | 15.21% | 10.53% |
| ROA (5Y Median) ⓘ | 6.26% | 5.44% |
| Net Debt / EBIT (Latest) ⓘ | 1.96 | 1.98 |
| Net Debt / EBIT (5Y Median) ⓘ | 2.06 | 2.35 |
| Net Debt / EBITDA (Latest) ⓘ | 1.33 | 1.38 |
| Net Debt / Assets ⓘ | 21.17% | 21.70% |
| EBITDA / Interest ⓘ | 19.86 | 9.49 |
| Operating Margin (Latest) ⓘ | 4.30% | 8.88% |
| Operating Margin (5Y Median) ⓘ | 3.78% | 9.57% |
| Debt to Equity (Latest) ⓘ | 75.08% | 72.35% |
| Profit Margin (Latest) ⓘ | 3.00% | 5.40% |
| Free Cash Flow (Latest) ⓘ | $13.51B | |
Momentum (Price trend) | ||
| 3Y Return ⓘ | +129.82% | +24.53% |
| 12M Return (excl. last month) ⓘ | +5.18% | +1.93% |
| 6M Return ⓘ | -7.48% | +1.61% |
| Price vs. 200-Day MA ⓘ | -0.07% | +2.99% |
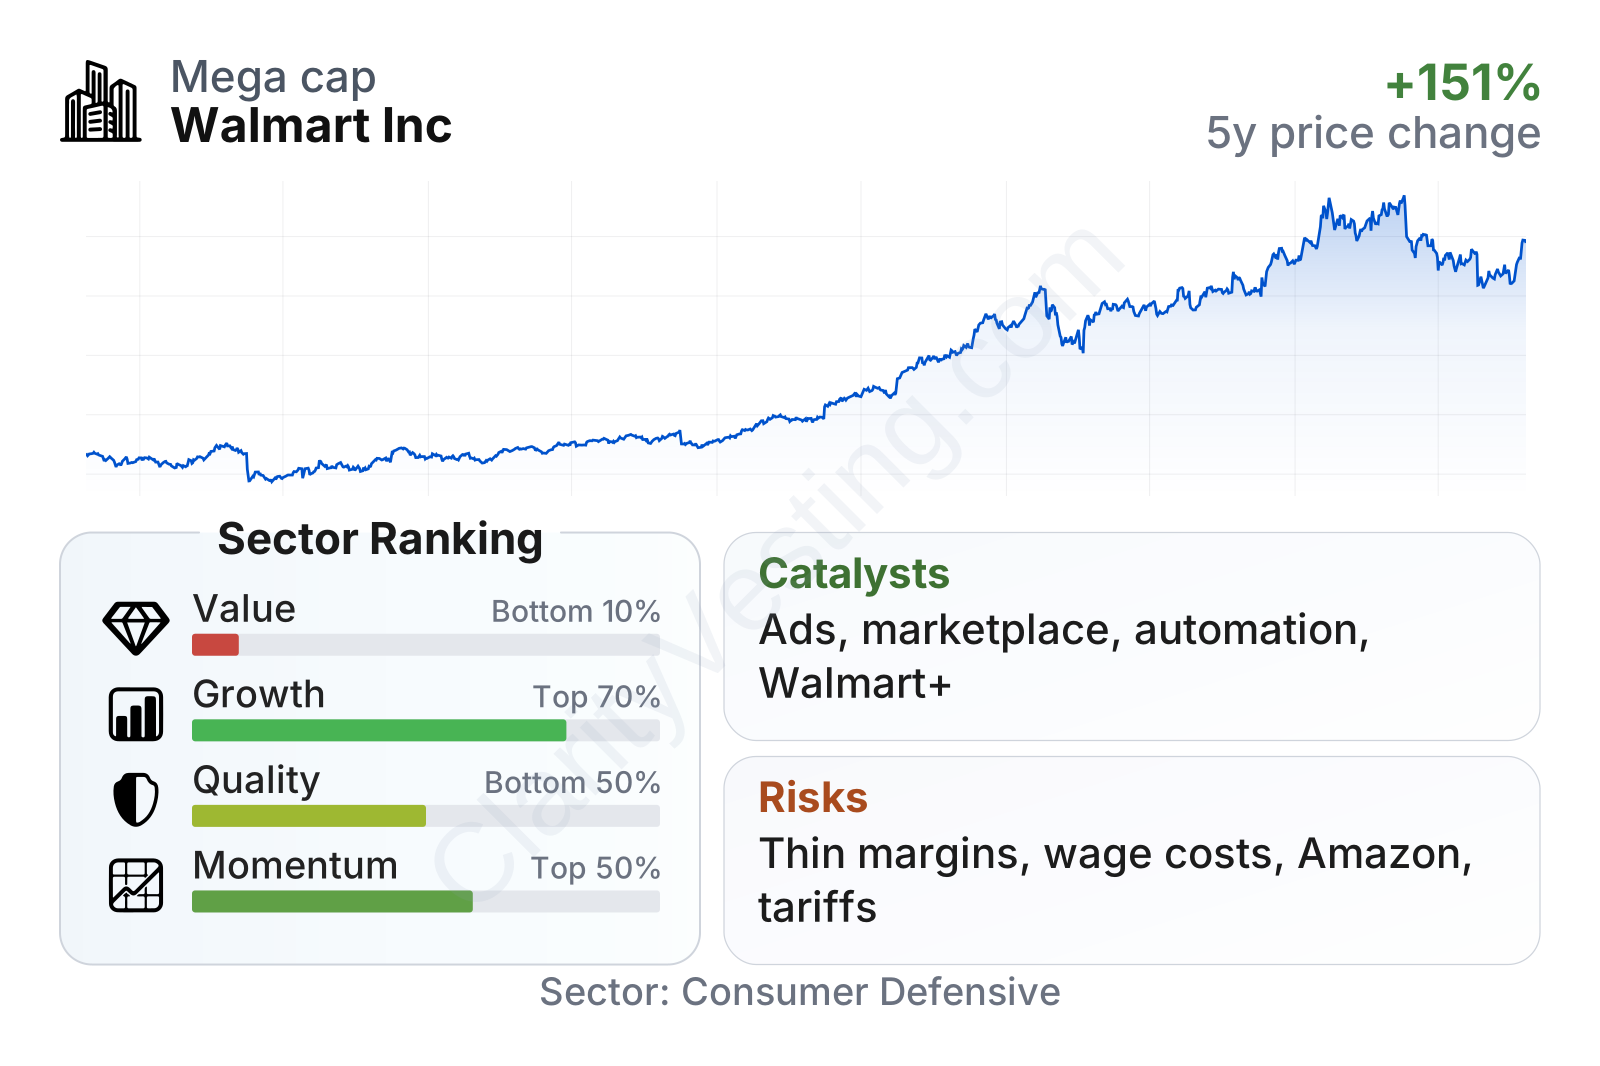
Walmart is a very large company with lower share-price volatility than the average stock, as reflected in its beta below 1. In the factor breakdown, growth and momentum look stronger than much of the consumer defensive sector, while value measures look expensive and quality is more mixed. That profile fits a business the market currently treats as a dependable compounder rather than a bargain-priced retailer.
The stock’s multi-year performance has been strong, although the recent pullback shows that even defensive names can correct when expectations become elevated. The table also suggests a split picture: revenue growth, free cash flow growth, and long-term capital efficiency are respectable, but the earnings multiple, price-to-book ratio, and cash flow yield leave little room for disappointment.
Growth
Walmart operates in a sector that is mature on the surface but still attractive in practice. Consumer staples and food retail are not fast-growing industries in the traditional sense, yet they are highly resilient because people continue to buy groceries and household essentials in almost any economic environment. What changes over time is where market share goes. Walmart’s growth case depends less on industry expansion and more on taking share, lifting digital penetration, and building higher-margin services around its huge customer base.
Its strategy for future growth is coherent. Walmart is investing in store upgrades, automation, supply chain efficiency, faster delivery, marketplace expansion, retail media advertising, and membership ecosystems such as Walmart+ and Sam’s Club. These initiatives make sense because they use assets Walmart already has: store proximity, purchasing power, customer traffic, and logistics density. In retail, that kind of infrastructure can be hard to replicate at scale.
Revenue growth has remained consistently positive, generally running in the mid-single-digit range, with some stronger periods above that level. For a company of Walmart’s size, that is a solid outcome. It suggests the business is still finding ways to expand despite already starting from a very large base.
Free cash flow has been somewhat uneven from year to year, which is normal for a retailer with major inventory movements and ongoing capital spending. Even so, the broader direction over the past several years has been upward, and the current level remains substantial in absolute terms. That matters because it supports reinvestment, dividends, and financial flexibility without requiring aggressive balance sheet risk.
One of the clearest catalysts is Walmart’s push into businesses that can earn better margins than core product sales. Advertising is a good example: brands pay to gain visibility on Walmart’s platforms, and this revenue does not require the same inventory risk as selling merchandise. Marketplace services are another important lever, since third-party sellers can expand assortment without Walmart owning all the inventory itself.
Another catalyst is convenience. The company continues to build on same-day delivery, pickup, pharmacy access, and store-based fulfillment. Because Walmart already has a large store footprint close to many households, it can use stores as local distribution points. That gives it a structural advantage as retail shifts further toward blended online-and-offline shopping.
Recent company communications have also emphasized technology and automation in distribution centers and stores. If execution remains solid, that can help productivity, inventory accuracy, and order economics over time. For a low-margin retailer, even small efficiency gains can have a meaningful effect on profit growth.
Risks
This article is for informational purposes only and does not constitute financial advice. Some content is AI-generated. See Disclaimer


