Stock Analysis · Williams Companies Inc (WMB)
Overview
Williams Companies is one of the largest energy infrastructure operators in the United States. Its business is centered on moving, processing, and storing natural gas and natural gas liquids through pipelines, gathering systems, and related facilities. Unlike oil and gas producers that depend directly on drilling results and commodity prices, Williams mainly earns money by providing transportation and processing services. That makes its business model more utility-like, with a large share of cash flow tied to long-term contracts and regulated assets.
The company’s asset base is especially important in natural gas. Williams owns and operates the Transco pipeline system, the major interstate natural gas pipeline running along the East Coast, and it also has a large footprint in gathering and processing areas linked to major U.S. shale basins. This positions the company between producers upstream and power plants, utilities, LNG export terminals, and industrial users downstream.
Based on the company’s recent annual reporting structure, revenue is primarily generated from the following sources:
- Transmission & Gulf of America: approximately 40% to 45% of total segment profit in recent reporting periods. This includes large interstate natural gas pipelines, especially Transco, plus storage and transportation services.
- Northeast G&P: approximately 20% to 25%. This covers gathering, processing, and pipeline services in the Marcellus and Utica regions, where natural gas production is among the largest in the U.S.
- West: approximately 15% to 20%. This includes gathering, processing, and transportation operations in the Rocky Mountains and surrounding areas.
- Gas & NGL Marketing Services: approximately 10% to 15%. This segment handles commodity-related optimization, NGL transportation and storage, and marketing activities.
- Other: usually a low-single portion of segment profit, including smaller operations and corporate items.
These percentages are best read as approximate shares of operating contribution rather than a simple sales mix, because midstream companies like Williams often have accounting revenue figures that can look volatile while underlying fee-based earnings are steadier.
Over the last several years, total revenue has moved within a fairly narrow range overall, but profitability has generally stayed strong. One notable pattern is that operating income and net income have remained solid even when reported revenue has not grown smoothly, which reflects the importance of contract quality and margin structure rather than pure top-line expansion.
The financial flow shows a business with durable operating profitability, but also meaningful financing costs. Interest expense remains large, which is normal for capital-intensive pipeline operators, yet it is a key item to watch because it absorbs a significant share of operating earnings.
Key Figures
| Metric | Value | Sector ⓘ |
|---|---|---|
| Date | Oct 17, 2026 | |
| Context | ||
| Sector | Energy | |
| Industry | Oil & Gas Midstream | |
| Market Cap ⓘ | $91.21B | |
| Beta ⓘ | 0.66 | |
Value (Cheapness) | ||
| P/E Ratio ⓘ | 29.59 | 15.44 |
| P/B Ratio ⓘ | 8.09 | 1.73 |
| FCF Yield ⓘ | -0.23% | 8.20% |
| Dividend Yield ⓘ | 2.76% | 3.59% |
| EBIT / EV ⓘ | 4.47% | 7.46% |
| PEG ⓘ | 2.07 | |
Growth (Business expansion) | ||
| Revenue Growth ⓘ | 7.80% | 26.90% |
| RPS Growth (5Y CAGR) ⓘ | 2.92% | 6.90% |
| EPS Growth (5Y CAGR) ⓘ | -9.53% | -15.73% |
| BVPS Growth (5Y CAGR) ⓘ | 5.02% | 6.07% |
| Margin Growth (5Y Trend) ⓘ | 11.80% | 0.58% |
| FCF Growth (5Y CAGR) ⓘ | -21.88% | 1.86% |
| DPS Growth (5Y CAGR) ⓘ | 5.16% | 16.79% |
Quality (Business durability) | ||
| ROIC (Latest) ⓘ | 9.62% | 11.40% |
| ROA (Latest) ⓘ | 5.28% | 6.06% |
| ROIC (5Y Median) ⓘ | 8.85% | 10.30% |
| ROA (5Y Median) ⓘ | 4.27% | 5.42% |
| Net Debt / EBIT (Latest) ⓘ | 5.72 | 1.64 |
| Net Debt / EBIT (5Y Median) ⓘ | 6.17 | 1.83 |
| Net Debt / EBITDA (Latest) ⓘ | 3.98 | 1.08 |
| Net Debt / Assets ⓘ | 50.47% | 17.29% |
| EBITDA / Interest ⓘ | 5.16 | 9.64 |
| Operating Margin (Latest) ⓘ | 43.85% | 16.27% |
| Operating Margin (5Y Median) ⓘ | 41.42% | 20.39% |
| Debt to Equity (Latest) ⓘ | 233.46% | 54.76% |
| Profit Margin (Latest) ⓘ | 24.94% | 8.82% |
| Free Cash Flow (Latest) ⓘ | -$214.00M | |
Momentum (Price trend) | ||
| 3Y Return ⓘ | +131.44% | +67.38% |
| 12M Return (excl. last month) ⓘ | +26.07% | +49.19% |
| 6M Return ⓘ | +3.40% | +7.07% |
| Price vs. 200-Day MA ⓘ | +2.76% | +9.56% |
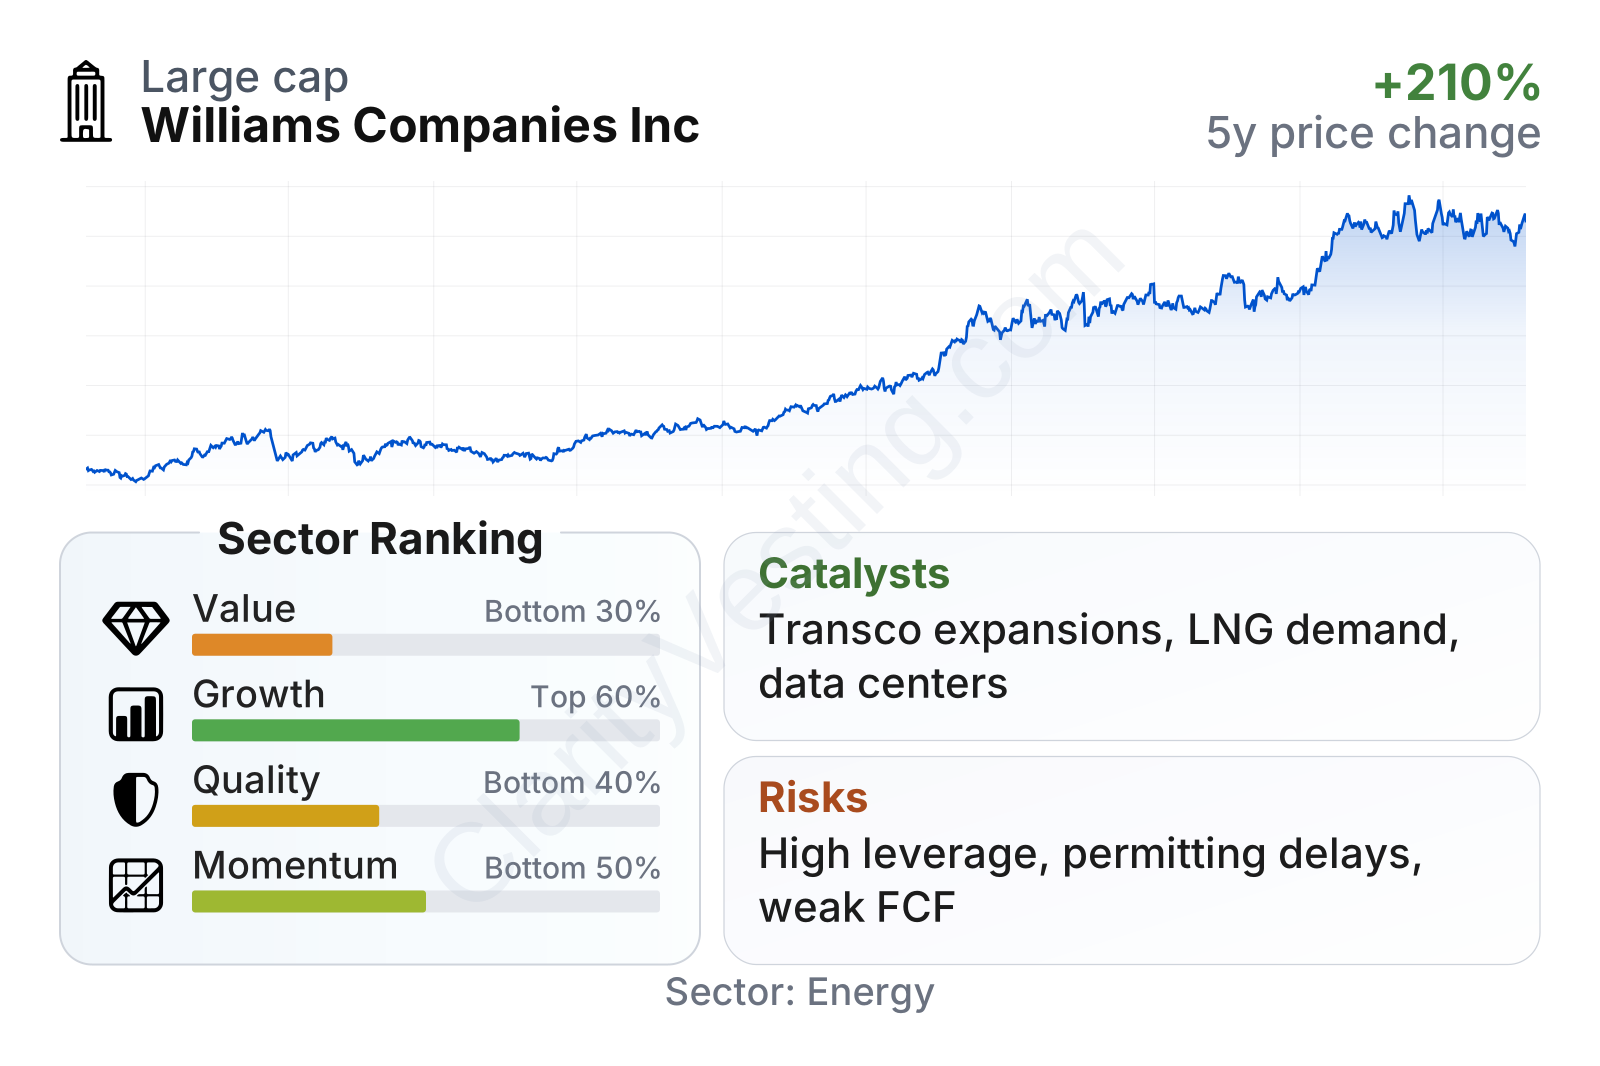
Williams is a very large midstream company with below-market share-price volatility, as shown by its beta well under 1. The quality picture is mixed: profitability stands out, with operating and profit margins well above the sector median, but leverage is also much higher than typical peers. Growth metrics are moderate rather than exceptional, and value metrics look demanding relative to the broader energy group, especially on earnings, book value, and enterprise-value-based measures.
The stock price trend over the last several years has been strong overall, with a sharp advance from 2021 through mid-2026. That rise helps explain why the dividend yield has compressed to around 3% and why traditional valuation ratios now appear richer than many energy peers.
Growth
Williams operates in a part of the energy market that still has visible long-term demand drivers. Natural gas remains important for U.S. power generation, industrial use, residential heating, and LNG exports. Even in a broader energy transition, gas infrastructure can continue to play a major role because it supports electricity reliability and often acts as a bridge fuel. That gives the company exposure to a sector with better durability than many people assume when they hear “traditional energy.”
The company’s strategy is also logically aligned with where demand is developing. Its crown-jewel asset, Transco, serves densely populated East Coast markets and connects supply basins to utilities, power plants, and LNG-related demand centers. That matters because pipeline capacity into premium demand regions is difficult to replicate due to permitting complexity, capital needs, and local opposition to new infrastructure. In practical terms, expansion projects on existing corridors can be more valuable than entirely new long-distance systems.
Revenue growth has not been smooth from quarter to quarter, which is normal in midstream because commodity-sensitive activities and contract timing can affect reported sales. More recently, growth has returned to positive territory, but it still trails the broader sector median. That suggests Williams is benefiting more from steady infrastructure demand and incremental expansions than from rapid cyclical surges.
Free cash flow has weakened materially from the stronger levels seen a few years ago and has recently moved close to break-even or below. That does not automatically signal business deterioration, because large pipeline operators often go through heavy capital-spending periods before new projects begin contributing. Still, for long-term analysis, it means growth currently depends in part on successful execution of expansion spending rather than on abundant excess cash today.
A meaningful catalyst is the continued rise of U.S. LNG exports and gas-fired electricity demand. As more gas is pulled from producing basins toward Gulf Coast export hubs and high-demand population centers, Williams is positioned to benefit through transportation volumes, storage usage, and system expansions. The company has also continued announcing and progressing projects tied to Transco and other gas infrastructure, reinforcing that management sees a multi-year runway for incremental capacity additions rather than one-off growth.
Recent company communications have also emphasized power demand from data centers and broader electric load growth as an emerging opportunity for natural gas infrastructure. That theme is becoming increasingly relevant across the U.S. energy system, and Williams has one of the asset networks most directly connected to major eastern demand markets.
Risks
This article is for informational purposes only and does not constitute financial advice. Some content is AI-generated. See Disclaimer


