Stock Analysis · Wilmar International Limited (WLMIF)
Overview
Wilmar International Limited is a large agribusiness and food company headquartered in Singapore. Its operations span the full chain from sourcing and processing agricultural commodities to manufacturing edible oils, consumer food products, specialty fats, oleochemicals, biodiesel, flour, rice, and sugar products. In simple terms, Wilmar sits between farms, commodity markets, food manufacturers, retailers, and end consumers. That broad position gives it exposure to both industrial demand and everyday food consumption.
The group’s revenue mix is heavily tilted toward food and feed ingredients, with a particularly strong presence in China and across Asia. Based on recent annual reporting, the main sources of revenue can be summarized approximately as follows:
- Food Products: about 50% to 55% of revenue. This includes consumer pack oils, rice, flour, noodles, and other branded or packaged food products sold mainly in Asia.
- Feed & Industrial Products: about 35% to 40% of revenue. This segment includes oilseed crushing, animal feed ingredients, oleochemicals, biodiesel, and other products tied to food manufacturing and industrial demand.
- Plantation & Sugar Milling: about 8% to 12% of revenue. This covers palm plantations, palm fresh fruit bunches, sugar milling, and related upstream agricultural activities.
That mix matters because it shows Wilmar is not just a plantation operator. A large share of sales comes from downstream processing and branded food activities, which are generally less volatile than pure raw commodity production. Over the last several years, revenue has stayed at a very large scale, while profits have moved more sharply as input prices, crushing margins, freight costs, financing costs, and commodity cycles changed.
The business flow also shows how thin-margin this model can be: most of Wilmar’s revenue is absorbed by raw material and operating costs before it reaches net income. Even so, the company’s scale remains one of its defining strengths.
The longer-term pattern shows a company with very high revenue conversion through cost of goods sold, modest operating margins, and profits that are sensitive to financing costs and market conditions. Revenue recovered in 2025 after a softer 2023-2024 period, while operating income improved from 2024 levels, suggesting that earnings can rebound meaningfully when processing conditions become more favorable.
Key Figures
| Metric | Value | Sector ⓘ |
|---|---|---|
| Date | Oct 10, 2026 | |
| Context | ||
| Sector | Consumer Defensive | |
| Industry | Packaged Foods | |
| Market Cap ⓘ | $18.73B | |
| Beta ⓘ | 0.13 | |
Value (Cheapness) | ||
| P/E Ratio ⓘ | 13.04 | 17.64 |
| P/B Ratio ⓘ | 0.99 | 1.27 |
| FCF Yield ⓘ | -0.76% | 12.68% |
| Dividend Yield ⓘ | 3.93% | 2.85% |
| EBIT / EV ⓘ | 7.48% | 6.32% |
| PEG ⓘ | 9.42 | |
Growth (Business expansion) | ||
| Revenue Growth ⓘ | 17.20% | 3.85% |
| RPS Growth (5Y CAGR) ⓘ | 2.41% | 6.20% |
| EPS Growth (5Y CAGR) ⓘ | -4.82% | -14.31% |
| BVPS Growth (5Y CAGR) ⓘ | -1.33% | 3.33% |
| Margin Growth (5Y Trend) ⓘ | -0.27% | -0.17% |
| FCF Growth (5Y CAGR) ⓘ | N/A | 4.37% |
| DPS Growth (5Y CAGR) ⓘ | -8.40% | 6.68% |
Quality (Business durability) | ||
| ROIC (Latest) ⓘ | N/A | 12.58% |
| ROA (Latest) ⓘ | 2.15% | 6.32% |
| ROIC (5Y Median) ⓘ | 4.97% | 10.38% |
| ROA (5Y Median) ⓘ | 2.50% | 5.44% |
| Net Debt / EBIT (Latest) ⓘ | 10.61 | 1.92 |
| Net Debt / EBIT (5Y Median) ⓘ | 8.80 | 2.32 |
| Net Debt / EBITDA (Latest) ⓘ | 7.21 | 1.36 |
| Net Debt / Assets ⓘ | 44.27% | 21.29% |
| EBITDA / Interest ⓘ | N/A | 9.52 |
| Operating Margin (Latest) ⓘ | 3.67% | 8.88% |
| Operating Margin (5Y Median) ⓘ | 4.48% | 9.53% |
| Debt to Equity (Latest) ⓘ | 146.40% | 71.95% |
| Profit Margin (Latest) ⓘ | 1.87% | 5.37% |
| Free Cash Flow (Latest) ⓘ | -$142.96M | |
Momentum (Price trend) | ||
| 3Y Return ⓘ | +35.28% | +18.12% |
| 12M Return (excl. last month) ⓘ | +35.94% | +2.64% |
| 6M Return ⓘ | +6.27% | +1.32% |
| Price vs. 200-Day MA ⓘ | +9.75% | +0.17% |
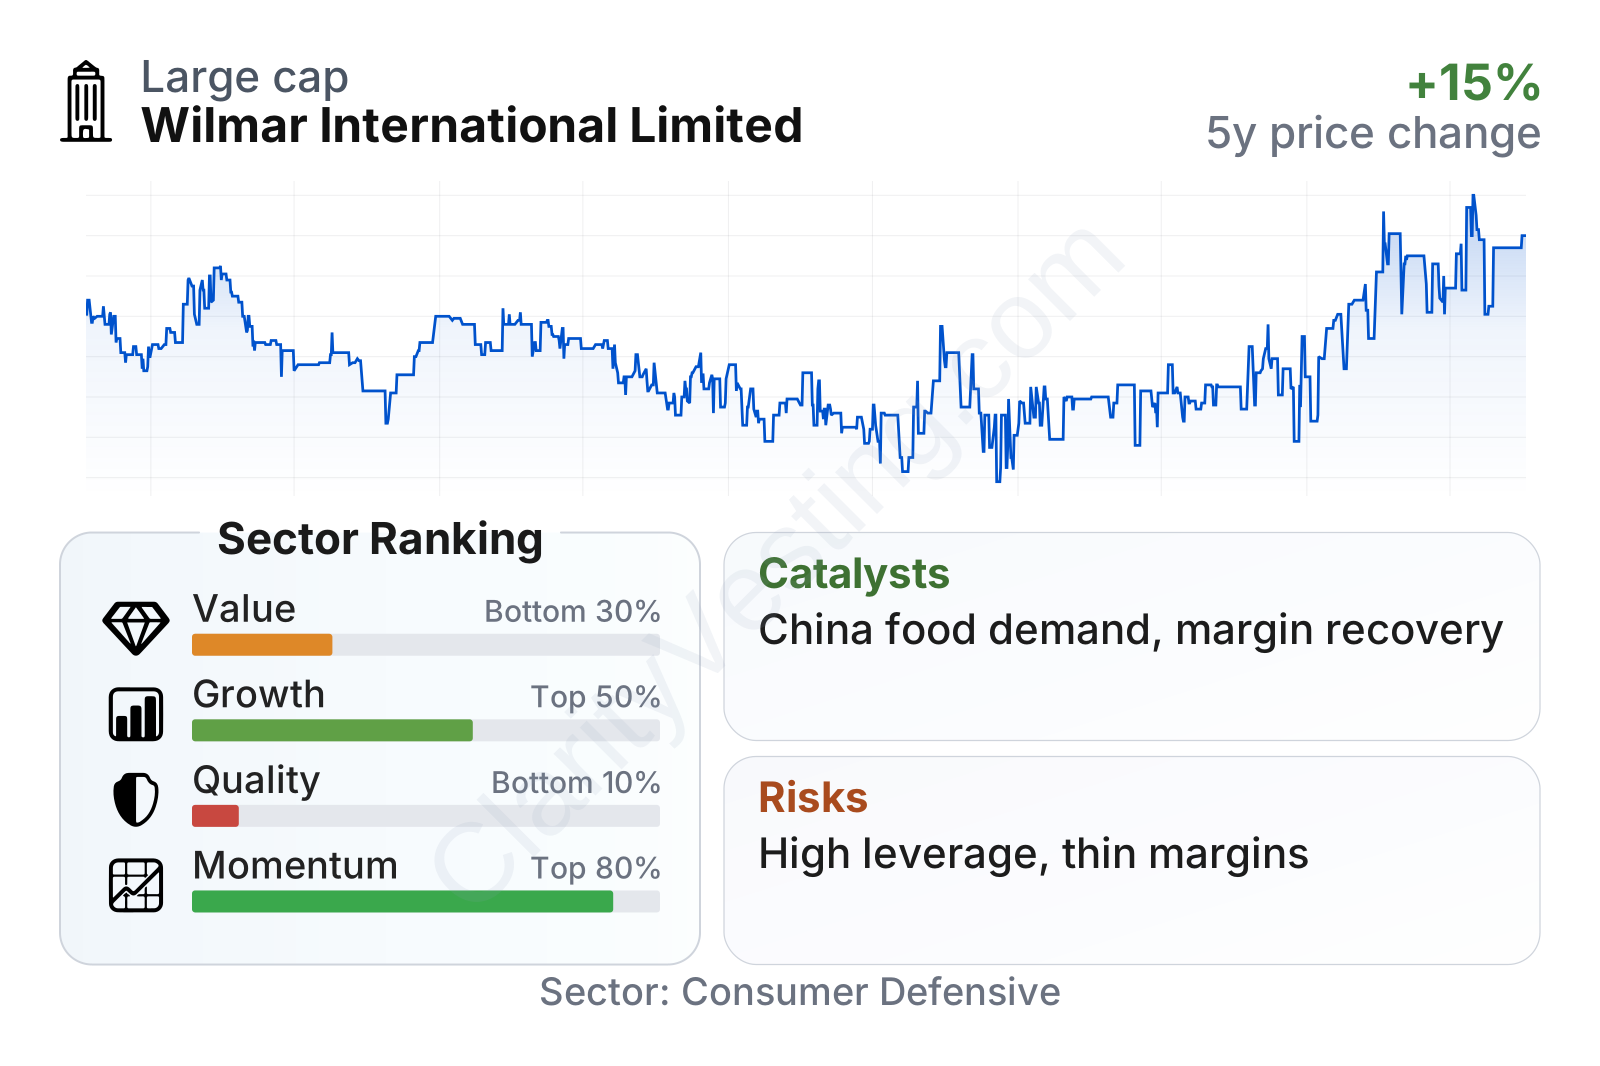
Wilmar is a large-cap consumer defensive name with unusually low share-price volatility, reflected in a beta close to zero. The broader factor profile is mixed. Growth and market performance rank relatively well against the sector, while value appears optically cheap on earnings and book value. However, quality metrics are weak, mainly because margins are thin, leverage is elevated, and free cash flow recently turned negative. The dividend yield is above the sector median, but that strength is partly offset by weaker cash generation.
The stock-price history also shows that the shares spent several years in a fairly low range before a sharp move higher in 2026, followed by some pullback. That suggests the market has recently started to re-rate the company, but not to the same valuation levels seen for many consumer staples peers.
Growth
Wilmar operates in sectors that have durable long-term demand: edible oils, staple foods, feed ingredients, and agricultural processing. These are not high-growth technology markets, but they are tied to population growth, urbanization, rising food consumption, and the need for large-scale food supply chains across Asia. That creates a steady structural base for the business, especially in China, India, Indonesia, and other densely populated regions where food demand continues to expand over time.
A key part of Wilmar’s strategy is moving beyond upstream commodity exposure and building more downstream and consumer-facing businesses. That approach makes strategic sense because branded foods, flour, rice, and specialty ingredients can produce more stable demand than raw commodity sales alone. It also allows the company to use its sourcing and logistics scale across more value-added products.
Recent revenue growth looks stronger than the sector median on a year-over-year basis, which points to improving business momentum. Still, the longer five-year trend is more moderate, so the current picture looks more like a recovery phase than a consistently fast compounder. Earnings growth over five years has also been pressured, showing that higher sales do not automatically translate into higher profits in this business.
Cash generation is an important point to watch. Wilmar’s recent free cash flow is negative, which means the company’s accounting profits have not recently converted well into cash after capital spending and working-capital needs. For a commodity-linked processor, that can happen when inventories, trade receivables, or expansion investments absorb cash. It does not automatically signal deterioration, but it does reduce flexibility compared with consumer staples peers that generate steadier surplus cash.
One meaningful catalyst is Wilmar’s continued positioning in Asian food consumption and processing. Another is any improvement in crushing margins, edible oil spreads, sugar conditions, and financing costs. Because Wilmar runs a huge volume business, relatively small changes in margins can have a noticeable impact on earnings. Recent recovery in operating income after the 2024 dip suggests that this operating leverage still matters.
Risks
This article is for informational purposes only and does not constitute financial advice. Some content is AI-generated. See Disclaimer


