Stock Analysis · World Kinect Corporation (WKC)
Overview
World Kinect Corporation is a global energy management and distribution company. It supplies fuel, power, natural gas, and related services to business customers rather than to ordinary retail drivers. The company operates across aviation, marine, and land-based markets, and it also provides sustainability-related services such as renewable fuel solutions, energy procurement, and carbon-management support. Its role is mainly that of a distributor, marketer, and service provider, connecting customers with energy supply, logistics, credit, and operational support.
The business is organized around three main operating segments. Based on recent annual reporting, revenue is heavily concentrated in fuel and energy distribution, where reported sales can move sharply with commodity prices even when physical volumes are more stable.
- Aviation: approximately 45% to 50% of revenue in recent years. This segment supplies jet fuel and aviation-related services to commercial airlines, cargo operators, private aviation, and airports.
- Land: approximately 35% to 40% of revenue. This includes diesel, gasoline, natural gas, and power supply, along with fleet, commercial, industrial, and government customer solutions.
- Marine: approximately 15% to 20% of revenue. This segment markets marine fuel, lubricants, and related services to shipping customers and vessel operators.
One important point for long-term readers is that very large revenue does not automatically mean very large profit. In fuel distribution, the cost of the product is extremely high, so gross and operating margins are naturally thin. World Kinect’s recent financial flow reflects that reality: tens of billions of dollars in sales translate into only a few hundred million dollars of operating income in normal years, which makes execution and cost control especially important.
The long-term pattern shows a business with enormous sales volume but structurally narrow margins. Revenue has fallen from the 2022 peak as energy prices normalized, while operating profit held up better until the large 2025 loss disrupted the trend. That makes margin recovery, not just sales growth, the key issue.
Key Figures
| Metric | Value | Sector ⓘ |
|---|---|---|
| Date | Oct 17, 2026 | |
| Context | ||
| Sector | Energy | |
| Industry | Oil & Gas Refining & Marketing | |
| Market Cap ⓘ | $1.86B | |
| Beta ⓘ | 1.23 | |
Value (Cheapness) | ||
| P/E Ratio ⓘ | N/A | 15.44 |
| P/B Ratio ⓘ | 1.52 | 1.73 |
| FCF Yield ⓘ | -0.87% | 8.20% |
| Dividend Yield ⓘ | 2.30% | 3.59% |
| EBIT / EV ⓘ | -0.70% | 7.46% |
| PEG ⓘ | 1.32 | |
Growth (Business expansion) | ||
| Revenue Growth ⓘ | 50.30% | 26.90% |
| RPS Growth (5Y CAGR) ⓘ | 8.04% | 6.90% |
| EPS Growth (5Y CAGR) ⓘ | N/A | -15.73% |
| BVPS Growth (5Y CAGR) ⓘ | -6.05% | 6.07% |
| Margin Growth (5Y Trend) ⓘ | -2.17% | 0.58% |
| FCF Growth (5Y CAGR) ⓘ | 14.12% | 1.86% |
| DPS Growth (5Y CAGR) ⓘ | 13.55% | 16.79% |
Quality (Business durability) | ||
| ROIC (Latest) ⓘ | -0.97% | 11.40% |
| ROA (Latest) ⓘ | -2.81% | 6.06% |
| ROIC (5Y Median) ⓘ | 5.68% | 10.30% |
| ROA (5Y Median) ⓘ | 0.96% | 5.42% |
| Net Debt / EBIT (Latest) ⓘ | N/A | 1.64 |
| Net Debt / EBIT (5Y Median) ⓘ | 2.94 | 1.83 |
| Net Debt / EBITDA (Latest) ⓘ | 8.51 | 1.08 |
| Net Debt / Assets ⓘ | 9.24% | 17.29% |
| EBITDA / Interest ⓘ | 0.43 | 9.64 |
| Operating Margin (Latest) ⓘ | -0.04% | 16.27% |
| Operating Margin (5Y Median) ⓘ | 0.46% | 20.39% |
| Debt to Equity (Latest) ⓘ | 59.26% | 54.76% |
| Profit Margin (Latest) ⓘ | -0.43% | 8.82% |
| Free Cash Flow (Latest) ⓘ | -$16.20M | |
Momentum (Price trend) | ||
| 3Y Return ⓘ | +90.87% | +67.38% |
| 12M Return (excl. last month) ⓘ | +42.41% | +49.19% |
| 6M Return ⓘ | +59.51% | +7.07% |
| Price vs. 200-Day MA ⓘ | +23.36% | +9.56% |
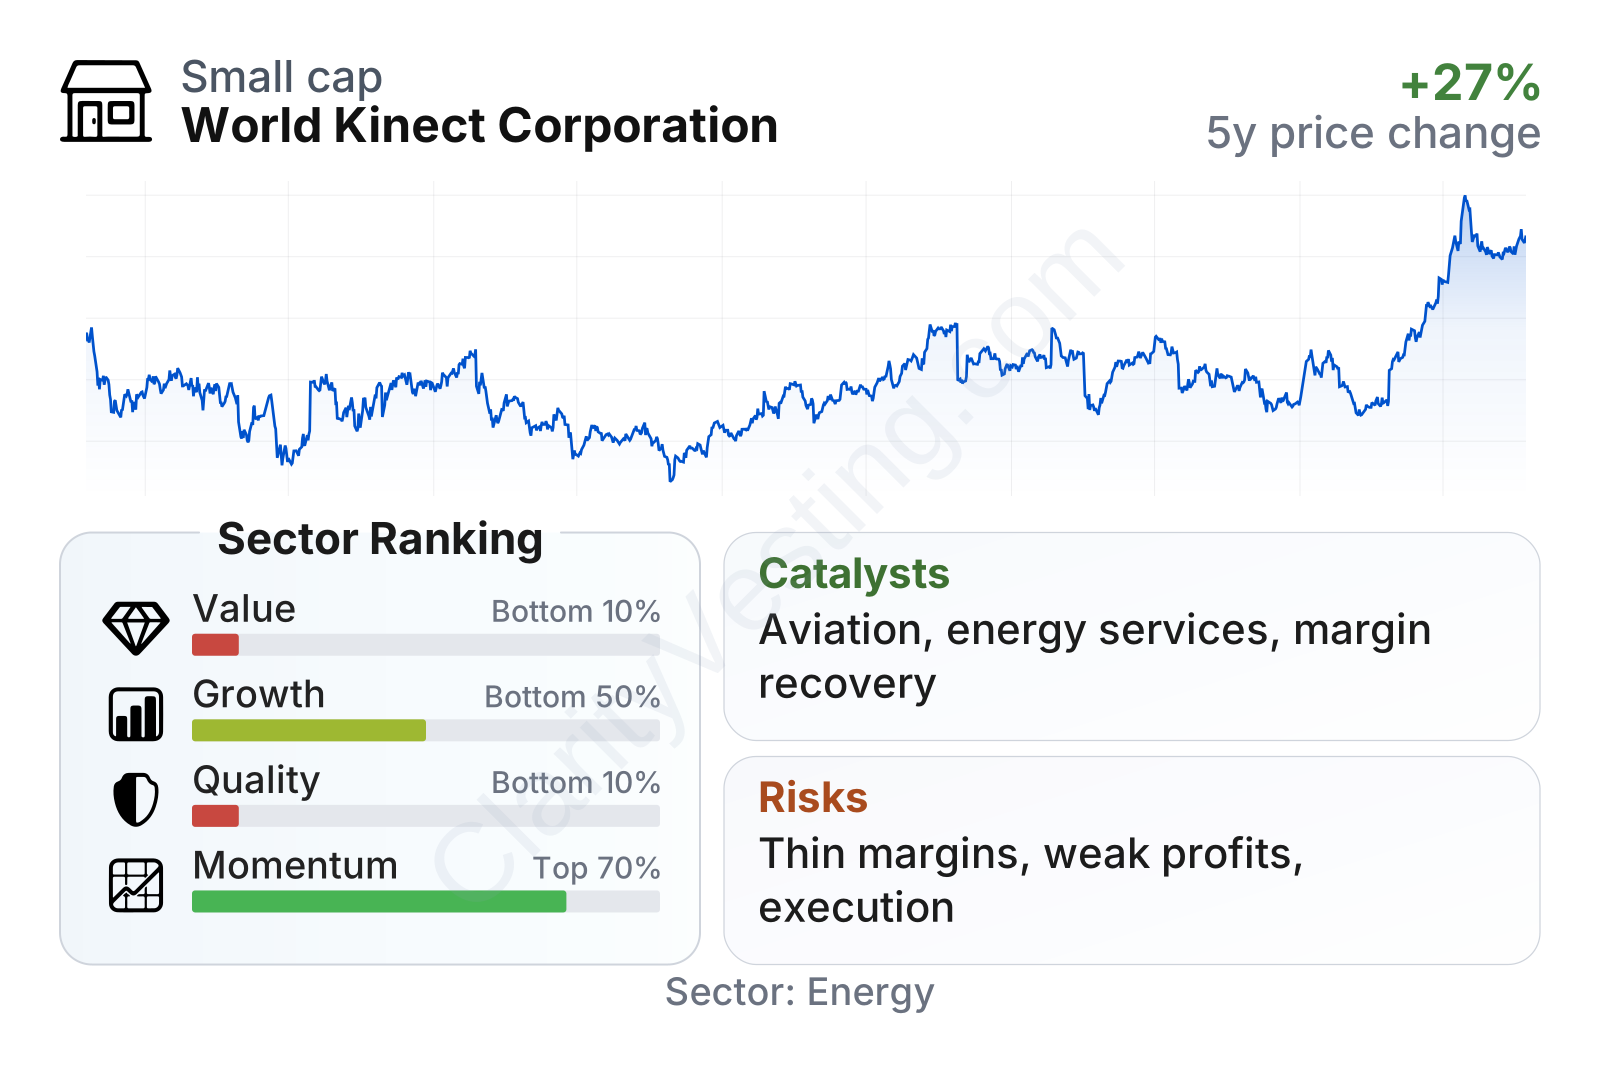
World Kinect is a mid-sized public company within the energy sector. The market action has been strong recently, with the share price well above its long-term average and a solid multi-year return profile. But the operating picture is more mixed. Growth metrics are not uniformly weak, especially on revenue per share and longer-term free cash flow trends, yet quality measures stand out as the weakest area. Recent profitability, returns on capital, and interest coverage are all far below typical sector levels, which helps explain why valuation screens do not look especially attractive despite the company’s modest price-to-book ratio.
Growth
World Kinect operates in energy distribution and commercial energy services, a sector that is not a classic high-growth market but can still offer expansion through scale, customer relationships, and a broader service mix. The company’s future growth case depends less on rising fuel demand alone and more on becoming a more integrated energy partner for business customers. That includes aviation fueling, marine supply, land transportation fuels, natural gas, electricity procurement, renewable fuel offerings, and sustainability services. This strategy makes industrial sense because many large customers increasingly want fewer vendors and more complete energy-management solutions.
A notable growth angle is the gradual shift from being viewed mainly as a fuel reseller to being seen as a broader energy solutions platform. In a changing energy landscape, that matters. Businesses still need traditional fuels, but they also face pressure to manage cost, emissions, reliability, and regulatory complexity. World Kinect’s existing customer network may give it a useful base from which to cross-sell these services.
Recent revenue trends show how volatile reported sales can be in this business. After a long period of declines as energy prices came down from the 2022 spike, growth turned positive again in 2026, with a much stronger rebound in the latest period. That suggests either improving market conditions, better volumes, or both. Still, for this company, revenue growth alone is not enough to prove durable progress because profits can remain weak even when sales recover.
Cash generation has also been uneven. Free cash flow was positive in several recent periods but has swung materially, and the latest trailing figure has slipped back below zero in the broader factor snapshot. For a low-margin distributor, consistent cash conversion is one of the clearest signs that operations are healthy, so a steadier trend here would strengthen the growth case more than revenue growth by itself.
As for catalysts, several company-reported developments matter. The group has continued to simplify operations and focus on efficiency, while also emphasizing higher-value service lines in aviation and broader energy solutions. If those efforts improve margins even slightly, the impact on earnings can be meaningful because the revenue base is so large. A recovery from the 2025 loss also creates the possibility of easier year-over-year comparisons in the near term.
Risks
This article is for informational purposes only and does not constitute financial advice. Some content is AI-generated. See Disclaimer


