Stock Analysis · WH Group Limited (WHGRF)
Overview
WH Group Limited is one of the world’s largest pork companies. It operates across the meat supply chain, from hog production and fresh pork to packaged meats sold under well-known local brands. The group is best known internationally as the owner of Smithfield Foods in the United States, while it also has major operations in China and Europe. Its business is largely tied to everyday food consumption, which gives it a defensive profile compared with more cyclical industries.
The company’s revenue comes mainly from three operating regions and from a mix of fresh pork and higher-margin packaged meat products. Based on recent annual reporting, the revenue mix is broadly concentrated as follows:
- United States: about 60% to 65% of revenue, mainly through Smithfield’s packaged meats, fresh pork, and hog production activities.
- China: about 25% to 30% of revenue, centered on packaged meats, fresh pork, and related processing.
- Europe: about 8% to 12% of revenue, with pork processing and packaged meat operations in several markets.
Looking at products rather than geography, fresh pork and packaged meats are the core earnings drivers, while hog production supports supply and can materially affect profitability depending on livestock cycles and feed costs. Packaged meats are especially important because they usually carry stronger margins and more brand value than commodity pork.
The business flow over the last several years shows a company with fairly stable sales in the mid-to-high tens of billions of dollars, but with profitability that can swing meaningfully from year to year. After a clear drop in 2023, operating income and net income recovered strongly in 2024 and remained solid in 2025. That pattern highlights an important feature of WH Group: this is a large food company, but not a perfectly smooth one, because meat margins depend on hog prices, grain costs, and regional supply-demand conditions.
The operating picture suggests a recovery in profitability rather than a straight-line growth path. Revenue has moved within a relatively narrow range over the past five years, while earnings improved sharply after the weak 2023 period. That points to a business where cost control, pricing, and product mix can matter as much as sales growth.
Key Figures
| Metric | Value | Sector ⓘ |
|---|---|---|
| Date | Oct 17, 2026 | |
| Context | ||
| Sector | Consumer Defensive | |
| Industry | Packaged Foods | |
| Market Cap ⓘ | $11.38B | |
| Beta ⓘ | 0.20 | |
Value (Cheapness) | ||
| P/E Ratio ⓘ | 7.17 | 17.88 |
| P/B Ratio ⓘ | 0.99 | 1.29 |
| FCF Yield ⓘ | 33.25% | 12.39% |
| Dividend Yield ⓘ | 9.07% | 2.85% |
| EBIT / EV ⓘ | 35.35% | 6.43% |
| PEG ⓘ | 21.24 | |
Growth (Business expansion) | ||
| Revenue Growth ⓘ | 3.30% | 4.10% |
| RPS Growth (5Y CAGR) ⓘ | 3.19% | 6.18% |
| EPS Growth (5Y CAGR) ⓘ | -31.30% | -13.59% |
| BVPS Growth (5Y CAGR) ⓘ | 4.79% | 3.20% |
| Margin Growth (5Y Trend) ⓘ | 2.37% | -0.15% |
| FCF Growth (5Y CAGR) ⓘ | 21.15% | 4.10% |
| DPS Growth (5Y CAGR) ⓘ | 56.49% | 6.79% |
Quality (Business durability) | ||
| ROIC (Latest) ⓘ | N/A | 12.34% |
| ROA (Latest) ⓘ | 14.98% | 6.30% |
| ROIC (5Y Median) ⓘ | 13.54% | 10.49% |
| ROA (5Y Median) ⓘ | 6.98% | 5.44% |
| Net Debt / EBIT (Latest) ⓘ | 0.62 | 1.96 |
| Net Debt / EBIT (5Y Median) ⓘ | 1.09 | 2.35 |
| Net Debt / EBITDA (Latest) ⓘ | 0.46 | 1.38 |
| Net Debt / Assets ⓘ | 11.64% | 21.51% |
| EBITDA / Interest ⓘ | 19.45 | 9.46 |
| Operating Margin (Latest) ⓘ | 7.54% | 8.87% |
| Operating Margin (5Y Median) ⓘ | 8.16% | 9.53% |
| Debt to Equity (Latest) ⓘ | 43.98% | 72.35% |
| Profit Margin (Latest) ⓘ | 5.44% | 5.40% |
| Free Cash Flow (Latest) ⓘ | $3.79B | |
Momentum (Price trend) | ||
| 3Y Return ⓘ | +126.49% | +20.92% |
| 12M Return (excl. last month) ⓘ | -10.77% | +2.13% |
| 6M Return ⓘ | -22.13% | +1.26% |
| Price vs. 200-Day MA ⓘ | +31.35% | +1.39% |
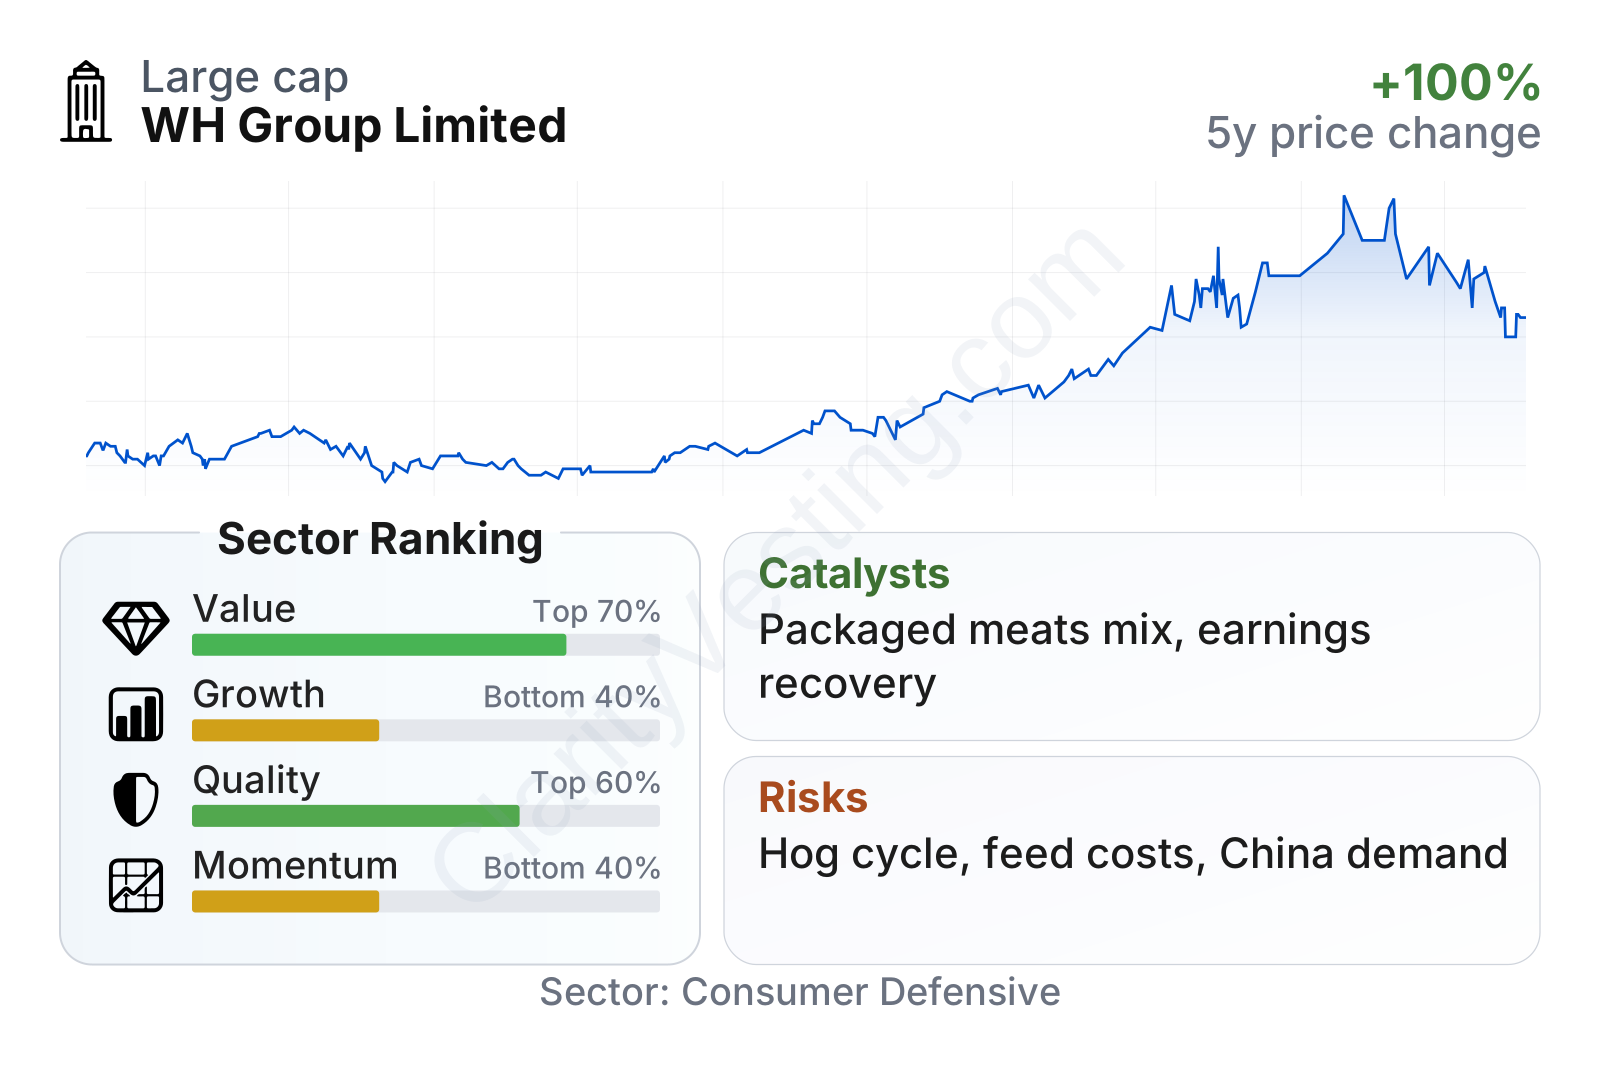
WH Group stands out more for cash generation and balance-sheet discipline than for rapid expansion. The company screens favorably on valuation, free cash flow, dividend yield, and leverage, while its growth profile looks weaker than much of the broader packaged foods sector. Profitability quality is respectable: returns on assets are strong, debt levels are moderate, and interest coverage is comfortable. The stock’s recent trading pattern has been mixed, with weakness over the last several months despite a much stronger three-year performance.
The company is also relatively large within its industry and shows unusually low share-price volatility, as reflected by a beta well below 1. That does not remove business risk, but it does fit the pattern of a staple-food company with a mature operating base.
Growth
WH Group operates in a sector with steady long-term demand rather than explosive expansion. Meat consumption is tied to population, income, food preferences, and restaurant traffic. In developed markets, volume growth tends to be modest, but branded packaged foods can still expand through pricing, product mix, convenience, and premium offerings. In China, the outlook is shaped by changing consumption patterns, modernization of food distribution, and consumer preference for safer and more standardized meat products.
The company’s strategy makes the most sense when viewed through margin improvement rather than pure volume growth. Packaged meats offer better economics than commodity pork, so increasing the share of branded, processed, and convenience-oriented products is a logical path. WH Group also benefits from being present in both China and the United States, giving it geographic diversification and access to two of the world’s most important pork markets.
A meaningful catalyst is the continued normalization of earnings after the difficult 2023 period. Recent years show that profitability can rebound sharply when operating conditions improve. Another support is the company’s strong cash generation, which creates room for dividends, debt management, and selective expansion. The business has also shown that it can protect its financial structure even when industry conditions become less favorable.
There is also a structural advantage in scale. Large procurement, processing, and distribution networks can support purchasing efficiency and customer reach. In a low-margin food business, that scale can translate into better resilience when input costs move abruptly.
Risks
This article is for informational purposes only and does not constitute financial advice. Some content is AI-generated. See Disclaimer


