Stock Analysis · Weatherford International plc (WFRD)
Overview
Weatherford International plc is an oilfield services and equipment company. In simple terms, it helps oil and natural gas producers drill wells, complete them, operate them efficiently, and keep production flowing over time. The company sells tools, equipment, software, and field services used both onshore and offshore, with operations across major producing regions including North America, the Middle East, Latin America, Europe, and Asia.
Weatherford organizes its business into three main product lines. Based on the company’s recent annual reporting, revenue is spread across these activities in roughly the following order:
- Drilling and Evaluation: approximately 41% of revenue. This includes managed pressure drilling, logging and formation evaluation, drilling tools, and related well construction services used before and during drilling.
- Well Construction and Completions: approximately 31% of revenue. This covers cementing products, liner hangers, casing equipment, and completion systems that prepare a well for production.
- Production and Intervention: approximately 28% of revenue. This includes artificial lift, intervention services, fishing tools, repair work, and production optimization used after a well starts operating.
This mix matters because Weatherford is not concentrated in only one narrow niche. It participates across much of the life cycle of a well, which gives it exposure to both new drilling activity and the longer-lasting need to maintain producing wells.
The business has also improved its financial structure materially in recent years. Revenue rose strongly from 2021 through 2024, while operating income and net income recovered from losses to solid profitability. Interest expense moved lower over the same period, showing the benefit of debt reduction. One softer point is that 2025 revenue and gross profit pulled back from 2024 levels, which suggests the company is no longer in the same sharp recovery phase as before and is now more exposed to the normal ups and downs of the oilfield cycle.
The longer trend shows a business that has become much healthier since 2021: sales expanded, profitability turned positive, and financing costs declined. At the same time, the latest period points to a slower environment than the post-recovery surge seen in 2022 through 2024.
Key Figures
| Metric | Value | Sector ⓘ |
|---|---|---|
| Date | Oct 17, 2026 | |
| Context | ||
| Sector | Energy | |
| Industry | Oil & Gas Equipment & Services | |
| Market Cap ⓘ | $5.52B | |
| Beta ⓘ | 1.05 | |
Value (Cheapness) | ||
| P/E Ratio ⓘ | 15.02 | 15.44 |
| P/B Ratio ⓘ | 3.05 | 1.73 |
| FCF Yield ⓘ | 9.51% | 8.20% |
| Dividend Yield ⓘ | 1.37% | 3.59% |
| EBIT / EV ⓘ | 8.64% | 7.46% |
| PEG ⓘ | 1.29 | |
Growth (Business expansion) | ||
| Revenue Growth ⓘ | -8.20% | 26.90% |
| RPS Growth (5Y CAGR) ⓘ | 6.80% | 6.90% |
| EPS Growth (5Y CAGR) ⓘ | 33.54% | -15.73% |
| BVPS Growth (5Y CAGR) ⓘ | 36.49% | 6.07% |
| Margin Growth (5Y Trend) ⓘ | 16.57% | 0.58% |
| FCF Growth (5Y CAGR) ⓘ | 17.39% | 1.86% |
| DPS Growth (5Y CAGR) ⓘ | 10.18% | 16.79% |
Quality (Business durability) | ||
| ROIC (Latest) ⓘ | 15.19% | 11.40% |
| ROA (Latest) ⓘ | 7.06% | 6.06% |
| ROIC (5Y Median) ⓘ | N/A | 10.30% |
| ROA (5Y Median) ⓘ | 8.32% | 5.42% |
| Net Debt / EBIT (Latest) ⓘ | 0.85 | 1.64 |
| Net Debt / EBIT (5Y Median) ⓘ | 1.31 | 1.83 |
| Net Debt / EBITDA (Latest) ⓘ | 0.57 | 1.08 |
| Net Debt / Assets ⓘ | 9.51% | 17.29% |
| EBITDA / Interest ⓘ | 7.14 | 9.64 |
| Operating Margin (Latest) ⓘ | 11.89% | 16.27% |
| Operating Margin (5Y Median) ⓘ | 13.40% | 20.39% |
| Debt to Equity (Latest) ⓘ | 90.67% | 54.76% |
| Profit Margin (Latest) ⓘ | 7.66% | 8.82% |
| Free Cash Flow (Latest) ⓘ | $525.00M | |
Momentum (Price trend) | ||
| 3Y Return ⓘ | -18.58% | +67.38% |
| 12M Return (excl. last month) ⓘ | +37.19% | +49.19% |
| 6M Return ⓘ | -23.83% | +7.07% |
| Price vs. 200-Day MA ⓘ | -18.66% | +9.56% |
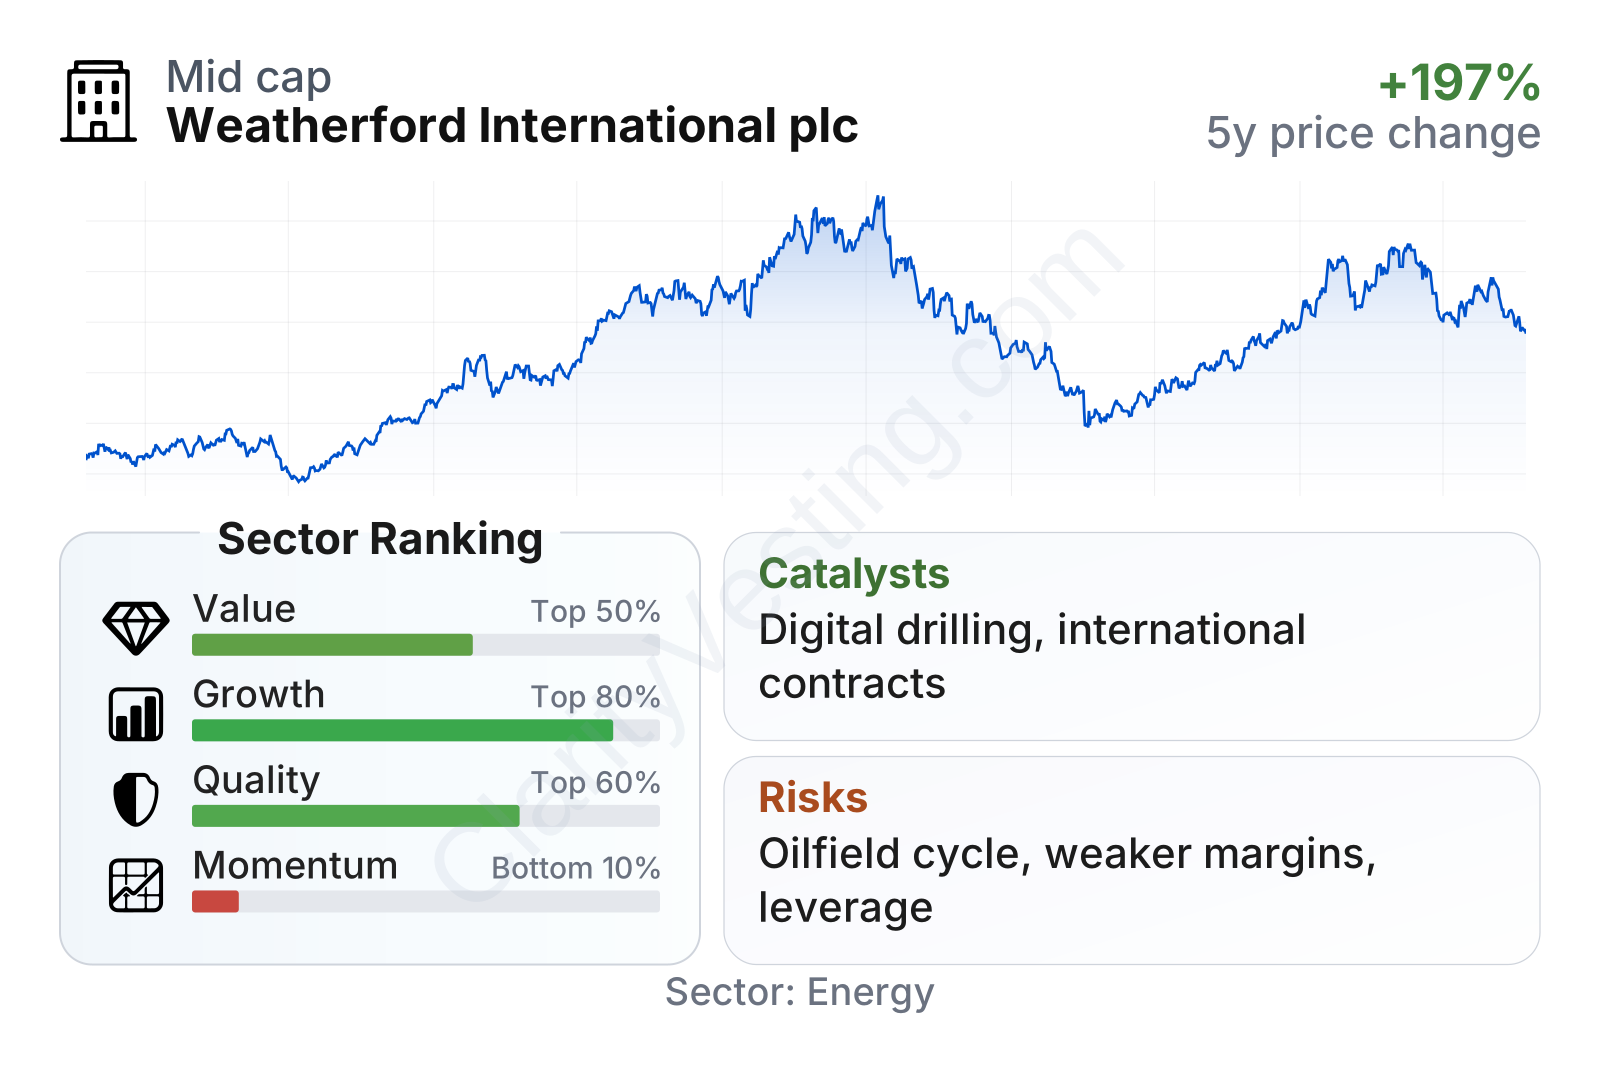
Weatherford is a mid-sized energy services company with a market value around the mid-single-digit billions of dollars. The stock has been volatile over the past several years, which is common in oilfield services. On fundamentals, the picture is mixed but generally improved versus the company’s own history. Value metrics look broadly reasonable relative to the sector, with earnings valuation close to the industry median and free cash flow yield slightly better. Quality indicators are also respectable: returns on capital and asset profitability are above sector medians, while leverage has fallen sharply from earlier years. The weaker area is momentum, where the recent share-price trend has lagged much of the sector despite a rebound over the last year.
Growth
Weatherford operates in a sector that should remain important for years, even as energy systems gradually diversify. Oil and gas still require ongoing drilling, well maintenance, production optimization, and equipment replacement. That creates durable demand for service companies, especially those with international exposure. Weatherford’s strategy is built around higher-value service lines, digital technologies, capital discipline, and a stronger presence in regions where national oil companies and large international operators continue to invest.
A key point for long-term growth is that Weatherford is more internationally exposed than some U.S.-focused peers. International oilfield markets often move on longer project cycles and can be less tied to short-term North American shale swings. This can support steadier activity in areas such as the Middle East, Latin America, and offshore developments, especially where customers prioritize production efficiency and recovery rates.
The revenue trend shows two distinct phases. First came a strong recovery period, with year-over-year growth frequently in the low-teens to mid-20% range through 2022 and much of 2023. More recently, growth turned negative, and the latest readings show revenue running below the prior year. That does not automatically break the long-term case, but it does show that Weatherford is now facing a cooler operating backdrop than during its earlier rebound.
Cash generation remains an important counterbalance. Free cash flow improved sharply from 2022 and stayed healthy even after coming down from its peak. With trailing free cash flow still around the half-billion-dollar range, the company has room to support debt reduction, technology investment, and shareholder returns. For a cyclical industrial business, that is a meaningful sign of progress.
Recent company updates have emphasized technology-led contracts, digital offerings, managed pressure drilling, and artificial lift opportunities. These are relevant because customers increasingly want higher recovery, lower downtime, and better well economics rather than just basic equipment supply. Weatherford is not the largest player in the industry, but it has a broad installed base and a portfolio that can benefit if operators keep spending on efficiency and mature-field optimization.
Risks
This article is for informational purposes only and does not constitute financial advice. Some content is AI-generated. See Disclaimer


