Stock Analysis · Wells Fargo & Company (WFC)
Overview
Wells Fargo & Company is one of the largest U.S. banks. It serves consumers, small businesses, middle-market companies, and large corporate clients through a nationwide banking network, digital channels, and specialized commercial and investment banking services. In simple terms, it makes money by taking deposits, lending those funds at higher rates, charging fees for banking and advisory services, and managing client assets.
Its business is organized into four main segments. Based on the company’s recent reporting, revenue is spread across the franchise in a fairly diversified way, although consumer and commercial banking still dominate the mix.
- Consumer Banking and Lending: about 39% of total revenue. This includes checking and savings accounts, credit cards, personal loans, home lending, auto lending, and branch-based consumer banking services.
- Commercial Banking: about 28% of total revenue. This covers lending, treasury management, and other banking services for middle-market businesses, large private companies, and real estate clients.
- Corporate and Investment Banking: about 23% of total revenue. This includes capital markets, investment banking, commercial real estate, corporate treasury solutions, and institutional client services.
- Wealth and Investment Management: about 10% of total revenue. This segment provides financial advice, brokerage, private banking, and asset management services for affluent and high-net-worth clients.
Another useful way to look at Wells Fargo is by revenue type rather than by business line. Like other large banks, a major share comes from net interest income, which is the spread between what it earns on loans and securities and what it pays on deposits and other funding. The rest comes from noninterest income, such as fees from card activity, investment advisory, brokerage, investment banking, mortgage-related activities, and other service charges. In recent years, the bank’s earnings mix has shown how sensitive results are to interest rates: higher rates supported interest income, while fee businesses helped offset pressure in slower lending or mortgage periods.
The business flow also shows a bank that has rebuilt earnings after the 2022 dip. Revenue and profit improved in 2023 through 2025, while operating expenses remained large, which is normal for a nationwide bank with heavy compliance, technology, staffing, and branch costs. The key point is that Wells Fargo remains a very large, deposit-funded financial institution with broad customer reach, but one still working to improve efficiency and returns.
Key Figures
| Metric | Value | Sector ⓘ |
|---|---|---|
| Date | Oct 19, 2026 | |
| Context | ||
| Sector | Financial Services | |
| Industry | Banks - Diversified | |
| Market Cap ⓘ | $251.75B | |
| Beta ⓘ | 0.95 | |
Value (Cheapness) | ||
| P/E Ratio ⓘ | 11.83 | 12.26 |
| P/B Ratio ⓘ | 1.46 | 1.23 |
| FCF Yield ⓘ | 7.61% | 10.40% |
| Dividend Yield ⓘ | 2.24% | 3.02% |
| EBIT / EV ⓘ | 11.28% | 8.14% |
| PEG ⓘ | 1.39 | |
Growth (Business expansion) | ||
| Revenue Growth ⓘ | 0.40% | 9.25% |
| RPS Growth (5Y CAGR) ⓘ | 17.30% | 12.19% |
| EPS Growth (5Y CAGR) ⓘ | 5.25% | -9.36% |
| BVPS Growth (5Y CAGR) ⓘ | 8.02% | 4.99% |
| Margin Growth (5Y Trend) ⓘ | -15.18% | -3.86% |
| FCF Growth (5Y CAGR) ⓘ | 13.31% | 4.81% |
| DPS Growth (5Y CAGR) ⓘ | 22.83% | 8.79% |
Quality (Business durability) | ||
| ROIC (Latest) ⓘ | 6.13% | 9.49% |
| ROE (Latest) ⓘ | 12.66% | 13.87% |
| ROA (Latest) ⓘ | 1.05% | 1.54% |
| ROIC (5Y Median) ⓘ | 5.45% | 7.86% |
| ROE (5Y Median) ⓘ | 10.44% | 12.17% |
| ROA (5Y Median) ⓘ | 1.02% | 1.30% |
| Net Debt / EBIT (Latest) ⓘ | 9.36 | 0.99 |
| Net Debt / EBIT (5Y Median) ⓘ | 3.36 | 0.73 |
| Net Debt / EBITDA (Latest) ⓘ | 5.41 | 0.91 |
| Operating Margin (Latest) ⓘ | 21.17% | 22.30% |
| Operating Margin (5Y Median) ⓘ | 20.40% | 24.63% |
| Debt to Equity (Latest) ⓘ | 125.76% | 58.04% |
| Profit Margin (Latest) ⓘ | 27.64% | 26.57% |
| Free Cash Flow (Latest) ⓘ | $19.17B | |
Momentum (Price trend) | ||
| 3Y Return ⓘ | +114.87% | +88.26% |
| 12M Return (excl. last month) ⓘ | +9.29% | +19.24% |
| 6M Return ⓘ | +4.41% | +4.70% |
| Price vs. 200-Day MA ⓘ | +0.40% | +3.66% |
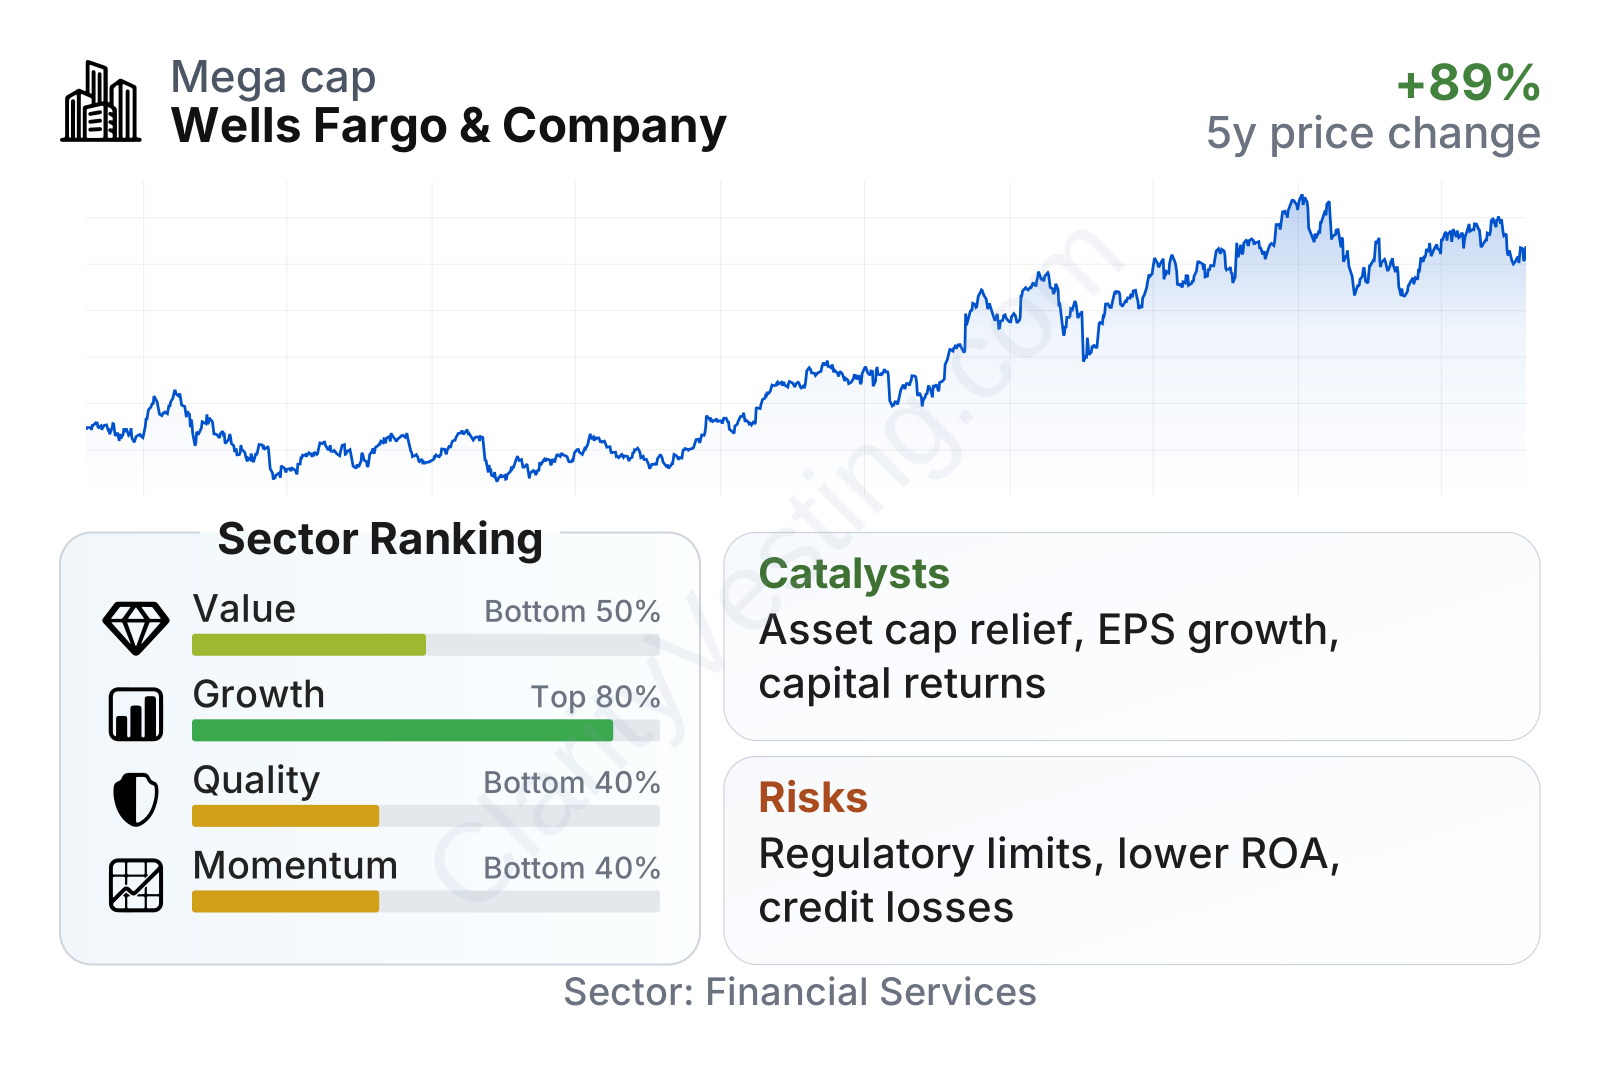
Wells Fargo is a very large bank with a market value in the hundreds of billions of dollars and a stock volatility close to the broader market. The overall picture from the latest metrics is mixed. Growth characteristics rank relatively well versus the sector, helped by strong multi-year gains in revenue per share, book value per share, free cash flow, and dividends per share. By contrast, quality metrics are weaker than many peers, with returns on equity and assets only recently recovering and leverage measures looking high, which is common in banking but still worth monitoring. On valuation, the stock does not look stretched on earnings, but it trades at a premium to the sector median on book value, suggesting the market is already recognizing part of the operational recovery.
The share price trend has been strong over the last three years, although momentum has cooled more recently. That combination usually points to a stock that has already re-rated upward and may now need further improvement in profitability or capital flexibility to support another step higher.
Growth
Banking is a mature sector, so Wells Fargo is not operating in a high-growth industry in the way a software or semiconductor company might. Still, large banks can grow steadily over time through loan growth, stronger fee income, cost discipline, digital adoption, and capital returns. In Wells Fargo’s case, the main long-term growth case is less about entering a brand-new market and more about improving a very large existing franchise that has been underperforming its potential for years.
That strategy is logical. Wells Fargo has a major U.S. deposit base, a well-known consumer brand, a sizable commercial banking platform, and a growing wealth business. If management can continue reducing expenses, strengthen fee-based businesses, and remove operating constraints tied to past regulatory issues, even moderate revenue growth can translate into better earnings growth. That matters because large banks often create value through incremental efficiency gains at scale rather than dramatic top-line expansion.
The earnings trend supports that recovery view. Earnings per share moved from the mid-$4 range in 2021 and 2022 to above $6 in 2025, showing that the bank has been improving profitability after a weaker period. That progression is important because it suggests earnings growth has not depended on a single quarter, but on a broader normalization in operations.
Book value per share has also advanced steadily, rising from around $41 in 2021 to the mid-$50s by 2025. For a bank, book value is especially useful because it reflects the equity base that supports lending and earnings generation. A rising book value per share usually signals that profits are being retained and capital strength is building over time.
The biggest catalyst remains regulatory normalization. Wells Fargo has spent years operating under an asset cap imposed by the Federal Reserve after its sales-practices scandal. Recent company communications have continued to emphasize work on risk controls, governance, and remediation. If those efforts result in further regulatory relief over time, the bank could gain more flexibility to expand its balance sheet, compete more freely in attractive lines of business, and improve efficiency. That would be a meaningful opportunity because the franchise is already large enough to benefit quickly from fewer constraints.
Another important growth lever is capital return. Wells Fargo has generated substantial profit and free cash flow, and its dividend per share has grown strongly over the last five years. When a large bank combines modest business growth with steady share repurchases and dividends, per-share results can improve even without rapid revenue expansion.
Risks
This article is for informational purposes only and does not constitute financial advice. Some content is AI-generated. See Disclaimer


