Stock Analysis · Wesfarmers Ltd (WFAFY)
Overview
Wesfarmers Ltd is a large Australian retail and industrial group best known for owning Bunnings, one of the leading home improvement chains in Australia and New Zealand. Over time, Wesfarmers has reshaped itself into a portfolio of businesses centered on consumer spending, home improvement, office and technology products, health-related distribution, and a smaller set of industrial and emerging operations. For long-term analysis, the key point is that this is not a single-brand company: it is a diversified group with one especially important profit engine.
The largest source of revenue is Bunnings, which sells building materials, tools, garden products, home improvement items, and trade supplies. Wesfarmers also generates substantial sales from Kmart Group, which includes Kmart and Target discount department stores; Officeworks, which sells office supplies, technology products, education products, and business services; and WesCEF, which includes chemicals, energy, and fertilizer activities. The group also has Health operations and a smaller portfolio of strategic investments and newer businesses.
Based on the latest annual mix disclosed by the company, the revenue base is approximately structured as follows:
- Bunnings: about 58% of group revenue. This is the core business and the main earnings contributor.
- Kmart Group: about 24%. This includes discount general merchandise retailing through Kmart and Target.
- Officeworks: about 7%. This covers office products, school supplies, furniture, print, and technology.
- WesCEF: about 7%. This includes chemicals, fertilizer, and energy-related operations.
- Health and other businesses: about 4% combined. This includes health distribution and developing operations.
This mix matters because Wesfarmers is exposed mainly to everyday consumer demand and housing-related spending rather than a single narrow end market. It also means the company benefits from scale, purchasing power, and brand recognition, while still carrying some protection from diversification across several business lines.
Over the last several years, the business has expanded revenue and lifted net income, while keeping interest costs manageable relative to operating earnings. The latest year still shows a large gross profit base and strong cash generation, although the reported cost structure can vary by business mix and accounting presentation from year to year.
Key Figures
Metric Value Sector ⓘ Date Oct 17, 2026 Context Sector Consumer Cyclical Industry Home Improvement Retail Market Cap ⓘ $61.53B Beta ⓘ 0.79 P/E Ratio ⓘ 31.51 16.89 P/B Ratio ⓘ 7.84 1.61 FCF Yield ⓘ 10.83% 8.99% Dividend Yield ⓘ 2.85% 2.73% EBIT / EV ⓘ N/A 6.69% PEG ⓘ N/A Revenue Growth ⓘ 3.80% 5.60% RPS Growth (5Y CAGR) ⓘ 5.86% 8.91% EPS Growth (5Y CAGR) ⓘ 3.81% -17.41% BVPS Growth (5Y CAGR) ⓘ -0.03% 5.62% Margin Growth (5Y Trend) ⓘ -0.24% -0.17% FCF Growth (5Y CAGR) ⓘ 27.06% 4.91% DPS Growth (5Y CAGR) ⓘ 9.86% 9.86% ROIC (Latest) ⓘ N/A 12.38% ROA (Latest) ⓘ 19.61% 5.49% ROIC (5Y Median) ⓘ 20.84% 10.75% ROA (5Y Median) ⓘ 9.39% 5.44% Net Debt / EBIT (Latest) ⓘ N/A 2.17 Net Debt / EBIT (5Y Median) ⓘ 2.90 2.30 Net Debt / EBITDA (Latest) ⓘ 1.11 1.50 Net Debt / Assets ⓘ 38.91% 21.57% EBITDA / Interest ⓘ 12.51 9.13 Operating Margin (Latest) ⓘ N/A 9.10% Operating Margin (5Y Median) ⓘ 9.07% 9.56% Debt to Equity (Latest) ⓘ 159.41% 75.99% Profit Margin (Latest) ⓘ 6.08% 5.31% Free Cash Flow (Latest) ⓘ $6.66B 3Y Return ⓘ +82.85% +15.94% 12M Return (excl. last month) ⓘ -11.18% -2.82% 6M Return ⓘ +4.70% -1.58% Price vs. 200-Day MA ⓘ -0.77% -3.31%
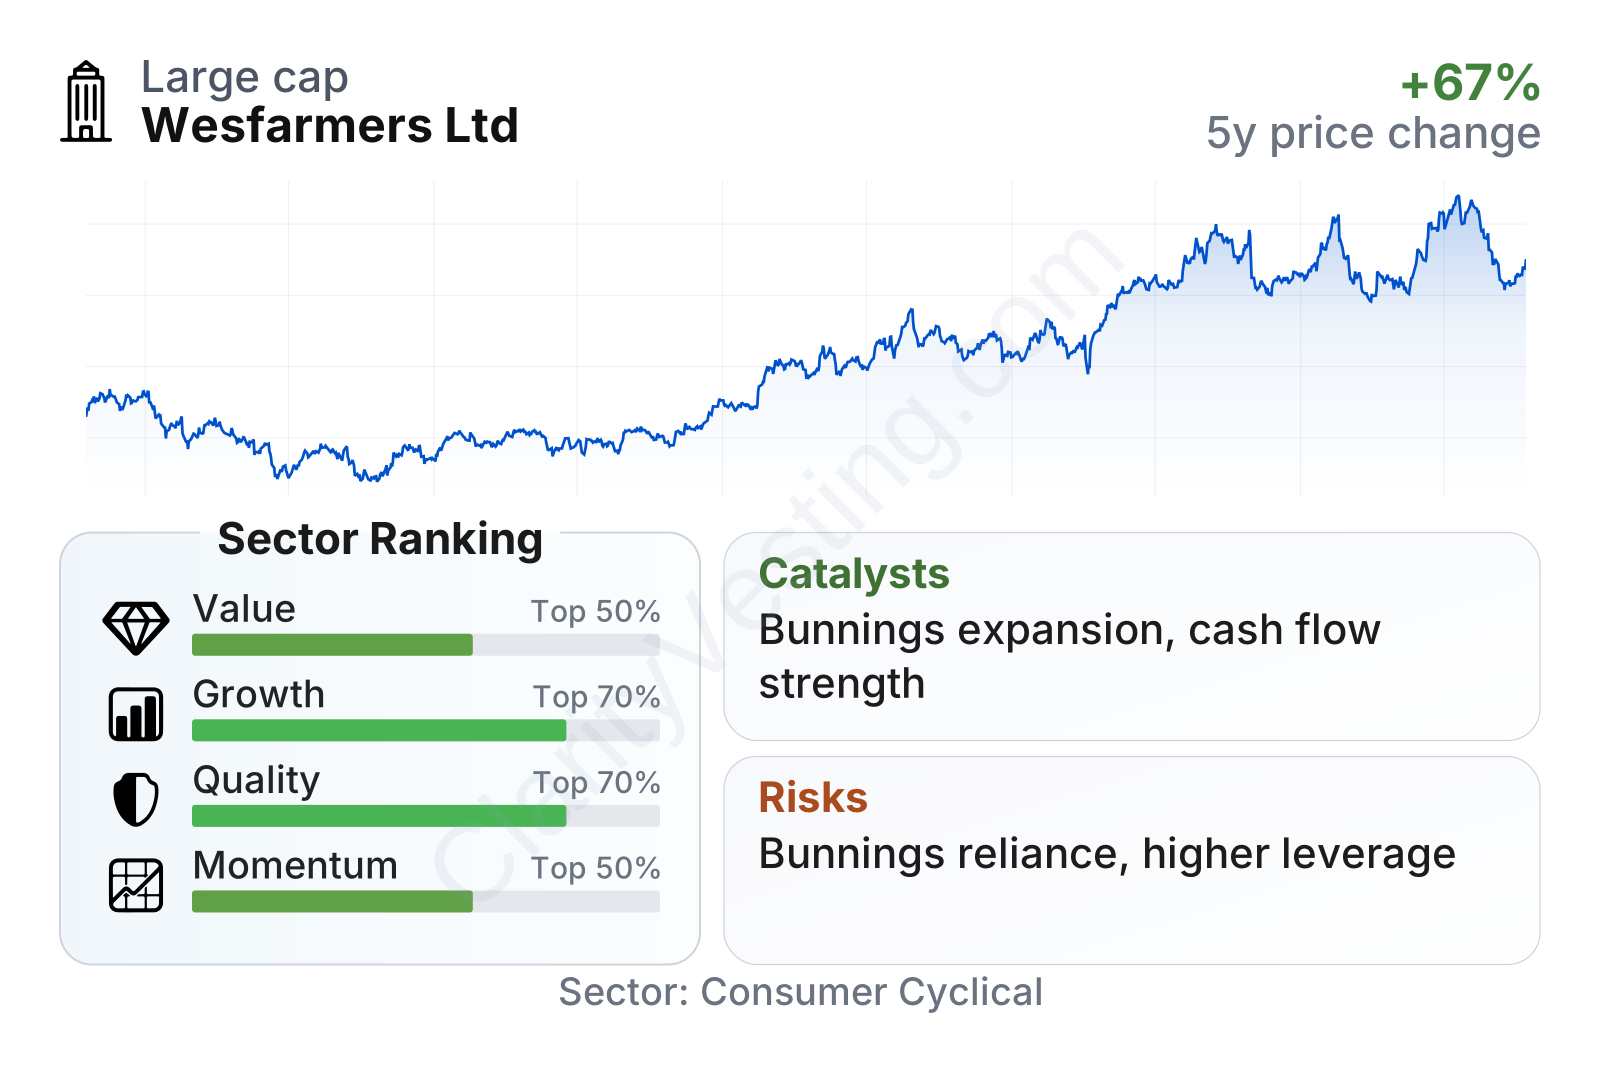
Wesfarmers combines large-company scale with solid business quality. The factor profile points to stronger quality than much of the sector, helped by very high returns on assets and strong long-term returns on invested capital. Growth is more mixed: revenue growth has been positive but not especially fast versus the sector median, while cash flow growth has been much stronger. The value picture is less favorable, with the shares trading on a noticeably higher earnings multiple and a much higher price-to-book ratio than the sector median. Momentum has been respectable over multi-year periods, even if the shares have recently sat below their 200-day average.
The share price record also shows a business that recovered strongly after the 2022 downturn and has moved materially higher over the last three years. That pattern suggests the market has steadily assigned a premium to the company’s durability, cash generation, and the central role of Bunnings in the portfolio.
Growth
Wesfarmers operates in sectors that are not high-growth in the startup sense, but they are large, resilient, and tied to recurring consumer and trade demand. Home improvement remains attractive over the long run because housing stock needs maintenance, renovation spending tends to return over time, and professional trade customers create a steadier demand layer than purely discretionary shoppers. Discount retail can also remain relevant in weaker consumer environments, since value-focused formats often gain traffic when households become more price-sensitive.
The company’s strategy is coherent for long-term growth. Bunnings continues to strengthen store productivity, supply chain capabilities, digital tools, and trade customer penetration. Kmart and Target give Wesfarmers a value retail presence that can benefit from scale and sourcing advantages. Officeworks adds a business and education angle, while health and newer investment areas create optionality beyond the mature core operations.
Recent revenue growth appears modest rather than explosive, which fits the profile of a mature market leader. That is not necessarily a weakness on its own: in a company like Wesfarmers, steady expansion combined with disciplined execution can be more important than rapid top-line growth.
One of the more encouraging features is cash generation. Free cash flow has been trending upward and sits at a high absolute level, which gives the group room to fund store investment, supply chain upgrades, dividends, acquisitions, and portfolio reshaping without depending heavily on external financing. The five-year cash flow growth record looks stronger than the broader sector, which supports the idea that operational execution has translated into real financial flexibility.
A notable catalyst in the current setup is the continued development of data, automation, retail media, and digital capabilities across the portfolio, especially at Bunnings and Kmart Group. Another is the company’s willingness to recycle capital into businesses where it sees stronger structural opportunities, including health and technology-adjacent areas. These are not overnight drivers, but they can improve earnings durability and keep the portfolio from becoming too dependent on one mature format.
Risks
This article is for informational purposes only and does not constitute financial advice. Some content is AI-generated. See Disclaimer


