Stock Analysis · Western Midstream Partners LP (WES)
Overview
Western Midstream Partners LP is a midstream energy company. In simple terms, it owns infrastructure that helps move oil, natural gas, and produced water from drilling areas to processing plants, pipelines, and disposal or recycling systems. Its assets are concentrated in major U.S. producing basins, especially the Delaware Basin in West Texas and New Mexico, the DJ Basin in Colorado, and parts of the Powder River Basin and other regions. Midstream companies like Western Midstream are generally less exposed to daily swings in commodity prices than producers because they earn much of their money from gathering, processing, transporting, and handling volumes under contracts.
The business is built around three main service lines. Based on the company’s recent reporting structure and segment disclosures, revenue is primarily generated from natural-gas-related services, followed by crude oil and natural gas liquids handling, and then produced-water services. Exact percentages can shift from quarter to quarter because some revenues depend on volumes, pricing formulas, and pass-through items, but the mix is broadly centered on gas infrastructure.
- Natural gas gathering, processing, and transportation: approximately 55% to 65% of revenue. This includes collecting raw gas from well sites, treating and processing it, and moving residue gas to downstream pipelines or markets.
- Crude oil and NGL gathering, stabilization, and transportation: approximately 20% to 30% of revenue. This covers moving oil and NGLs through pipelines and related systems, plus certain terminal and stabilization services.
- Produced-water gathering, disposal, and recycling: approximately 10% to 20% of revenue. This part of the business supports drilling and production activity by transporting water away from wells and handling disposal or reuse.
One of the most important features of Western Midstream’s model is customer concentration. A large share of throughput comes from Occidental and Chevron-affiliated production in core basins, especially after industry consolidation reshaped upstream ownership. That concentration creates both stability and dependency: strong basin positions can support steady volumes, but the company relies heavily on a relatively small number of large producers.
Over the last several years, the business has shown an ability to convert revenue into sizable operating income and cash flow. Revenue has generally trended upward, while margins have remained notably strong for the sector, reflecting the value of its established systems in attractive producing regions.
The financial flow also shows a business with high operating profitability relative to revenue, although net income has been more uneven because of higher costs, interest expense, and normal fluctuations in volume and contract mix.
Key Figures
| Metric | Value | Sector ⓘ |
|---|---|---|
| Date | Oct 17, 2026 | |
| Context | ||
| Sector | Energy | |
| Industry | Oil & Gas Midstream | |
| Market Cap ⓘ | $18.73B | |
| Beta ⓘ | 0.71 | |
Value (Cheapness) | ||
| P/E Ratio ⓘ | 14.34 | 15.44 |
| P/B Ratio ⓘ | 4.35 | 1.73 |
| FCF Yield ⓘ | 12.01% | 8.20% |
| Dividend Yield ⓘ | 8.13% | 3.59% |
| EBIT / EV ⓘ | 5.49% | 7.46% |
| PEG ⓘ | 5.48 | |
Growth (Business expansion) | ||
| Revenue Growth ⓘ | 30.00% | 26.90% |
| RPS Growth (5Y CAGR) ⓘ | 8.09% | 6.90% |
| EPS Growth (5Y CAGR) ⓘ | -12.05% | -15.73% |
| BVPS Growth (5Y CAGR) ⓘ | 7.60% | 6.07% |
| Margin Growth (5Y Trend) ⓘ | -3.69% | 0.58% |
| FCF Growth (5Y CAGR) ⓘ | 0.20% | 1.86% |
| DPS Growth (5Y CAGR) ⓘ | 28.66% | 16.79% |
Quality (Business durability) | ||
| ROIC (Latest) ⓘ | 12.57% | 11.40% |
| ROA (Latest) ⓘ | 8.89% | 6.06% |
| ROIC (5Y Median) ⓘ | 13.48% | 10.30% |
| ROA (5Y Median) ⓘ | 8.61% | 5.42% |
| Net Debt / EBIT (Latest) ⓘ | 5.89 | 1.64 |
| Net Debt / EBIT (5Y Median) ⓘ | 4.78 | 1.83 |
| Net Debt / EBITDA (Latest) ⓘ | 3.91 | 1.08 |
| Net Debt / Assets ⓘ | 55.30% | 17.29% |
| EBITDA / Interest ⓘ | 5.41 | 9.64 |
| Operating Margin (Latest) ⓘ | 35.36% | 16.27% |
| Operating Margin (5Y Median) ⓘ | 45.11% | 20.39% |
| Debt to Equity (Latest) ⓘ | 214.38% | 54.76% |
| Profit Margin (Latest) ⓘ | 29.00% | 8.82% |
| Free Cash Flow (Latest) ⓘ | $2.25B | |
Momentum (Price trend) | ||
| 3Y Return ⓘ | +113.43% | +67.38% |
| 12M Return (excl. last month) ⓘ | +36.27% | +49.19% |
| 6M Return ⓘ | +14.86% | +7.07% |
| Price vs. 200-Day MA ⓘ | +4.73% | +9.56% |
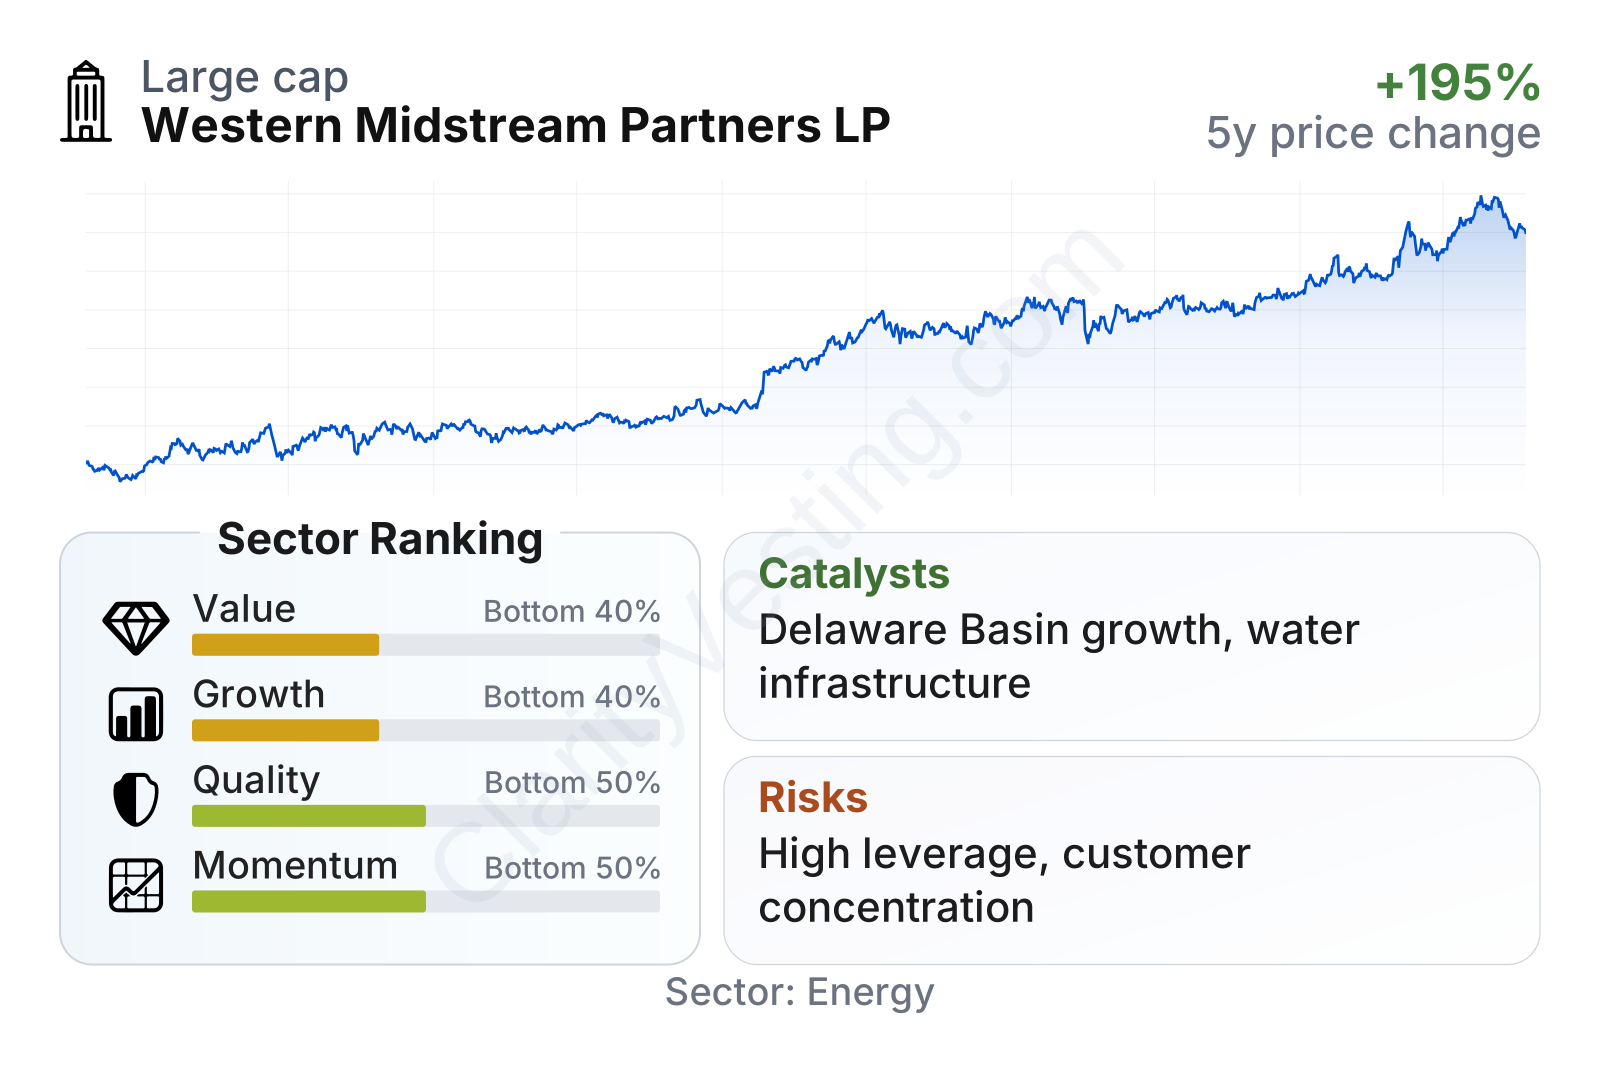
Western Midstream stands out as a large midstream operator with a relatively low beta, which suggests the stock has historically moved less than the broader market. The metrics show a mixed but understandable profile: profitability and cash generation look strong, while leverage weighs on the overall quality picture. The value profile is not clearly cheap on every measure. Its free cash flow yield and distribution yield are stronger than many peers, but enterprise-value-based valuation looks less favorable than the sector median, meaning the market is already recognizing part of the company’s cash-producing ability.
The stock’s longer-term price trend has been strong, with gains over the last three years ahead of the sector median. Momentum has moderated at times, but the broader direction has remained positive.
Growth
Western Midstream operates in a sector that still has long-term relevance even during the energy transition. Oil and gas production in the U.S. still needs pipelines, processing plants, compression, water systems, and related infrastructure. That is especially true in low-cost basins such as the Delaware Basin, where producers tend to keep drilling through more parts of the commodity cycle. For a midstream company, growth does not necessarily mean explosive expansion; it often means adding targeted infrastructure around active acreage, signing long-term contracts, and increasing utilization of assets already in place.
The company’s strategy makes sense in that context. Western Midstream has focused on building around existing high-quality positions rather than chasing growth everywhere. That approach can support returns because connecting new wells to an existing network is often more efficient than constructing entirely new systems. Water infrastructure is also becoming more important, since produced-water handling is a recurring operational need for producers and can create sticky customer relationships.
Recent revenue growth has reaccelerated after a weaker patch in 2023. The latest year-over-year trend shows a clear pickup, helped by stronger throughput and expansion activity in key basins. Over a five-year view, revenue per share growth has been better than the sector median, which suggests the asset base has become more productive even if growth has not been perfectly smooth.
Free cash flow has remained substantial, although not on a straight line. That matters because midstream companies rely on cash generation to fund maintenance spending, distributions, and debt management. Western Midstream’s ability to produce well over $1 billion in trailing free cash flow, even with some variability, supports the view that the business has real financial durability.
A notable catalyst is ongoing development in the Delaware Basin, where the company has one of its most valuable footprints. If large customers continue to develop acreage there, Western Midstream can benefit from higher gas, oil, and water volumes without needing a dramatic change in strategy. Another positive factor is its emphasis on capital discipline: selective expansions tied to visible customer demand are typically less risky than speculative buildouts.
Recent company communications have also highlighted continued infrastructure additions and commercial activity around core systems. For a midstream operator, that kind of incremental expansion is meaningful because it can lift volumes and cash flow without fundamentally changing the risk profile of the business.
Risks
This article is for informational purposes only and does not constitute financial advice. Some content is AI-generated. See Disclaimer


