Stock Analysis · Webjet Limited (WEJTY)
Overview
Webjet Limited is an Australian travel company focused on booking technology and travel distribution. Its business connects travelers, travel agents, and travel suppliers such as hotels, airlines, and other accommodation providers. In simple terms, the company makes money by helping travel demand meet travel inventory through digital platforms. The group has historically operated across consumer online travel booking and business-to-business travel distribution, with a strong emphasis in recent years on wholesale hotel distribution through WebBeds and on travel booking services in Australia and New Zealand.
The company’s revenue base has changed over time as management reshaped the portfolio. Based on recent company reporting, the main operating activities can be summarized as follows:
- WebBeds: the largest earnings engine. This business distributes hotel room inventory to travel agents, tour operators, and other intermediaries worldwide. It typically represents the majority of group revenue and transaction volume.
- Webjet OTA: the consumer-facing online travel agency in Australia and New Zealand, where customers book flights, hotels, packages, and related travel products through the Webjet brand.
- Other travel services and corporate items: smaller activities, support functions, and items that do not form the core operating engine.
Because Webjet reports with a mix of revenue, total transaction value, and segment profitability depending on the period, clean percentage splits are not always directly comparable. Still, recent disclosures indicate that WebBeds is the dominant contributor to group activity, while the consumer online travel operation is materially smaller but still meaningful in cash generation and brand visibility.
The business model is attractive when travel demand is healthy because digital distribution can scale well. A booking platform can process more volume without costs rising at the same pace, which helps margins improve when the cycle is favorable.
The multi-year profit flow shows a business that recovered sharply after the travel downturn, with revenue and operating profit rebounding strongly by 2024. The latest year still reflects profitability, but with more pressure than the prior peak period, suggesting that Webjet remains operationally strong while not being fully insulated from shifts in travel demand, restructuring, or mix changes.
Key Figures
| Metric | Value | Sector ⓘ |
|---|---|---|
| Date | Nov 04, 2026 | |
| Context | ||
| Sector | Consumer Cyclical | |
| Industry | Travel Services | |
| Market Cap ⓘ | $844.41M | |
| Beta ⓘ | 1.09 | |
Value (Cheapness) | ||
| P/E Ratio ⓘ | 39.17 | 17.77 |
| P/B Ratio ⓘ | 1.55 | 1.68 |
| FCF Yield ⓘ | 15.67% | 8.69% |
| Dividend Yield ⓘ | N/A | 2.60% |
| EBIT / EV ⓘ | N/A | 6.54% |
| PEG ⓘ | N/A | |
Growth (Business expansion) | ||
| Revenue Growth ⓘ | 19.90% | 5.20% |
| RPS Growth (5Y CAGR) ⓘ | 29.60% | 9.01% |
| EPS Growth (5Y CAGR) ⓘ | N/A | -13.92% |
| BVPS Growth (5Y CAGR) ⓘ | -5.34% | 5.64% |
| Margin Growth (5Y Trend) ⓘ | 73.62% | -0.17% |
| FCF Growth (5Y CAGR) ⓘ | 54.16% | 5.51% |
| DPS Growth (5Y CAGR) ⓘ | -34.73% | 10.11% |
Quality (Business durability) | ||
| ROIC (Latest) ⓘ | N/A | 11.85% |
| ROA (Latest) ⓘ | 1.68% | 5.50% |
| ROIC (5Y Median) ⓘ | 5.47% | 10.58% |
| ROA (5Y Median) ⓘ | 2.23% | 5.37% |
| Net Debt / EBIT (Latest) ⓘ | -1.47 | 2.12 |
| Net Debt / EBIT (5Y Median) ⓘ | -2.66 | 2.27 |
| Net Debt / EBITDA (Latest) ⓘ | -0.94 | 1.45 |
| Net Debt / Assets ⓘ | -12.48% | 21.34% |
| EBITDA / Interest ⓘ | N/A | 9.78 |
| Operating Margin (Latest) ⓘ | 23.26% | 9.01% |
| Operating Margin (5Y Median) ⓘ | 16.63% | 9.57% |
| Debt to Equity (Latest) ⓘ | 43.90% | 75.07% |
| Profit Margin (Latest) ⓘ | 9.01% | 5.41% |
| Free Cash Flow (Latest) ⓘ | $132.29M | |
Momentum (Price trend) | ||
| 3Y Return ⓘ | -33.88% | +19.12% |
| 12M Return (excl. last month) ⓘ | -45.75% | -4.66% |
| 6M Return ⓘ | -22.95% | +1.16% |
| Price vs. 200-Day MA ⓘ | +7.98% | +0.65% |
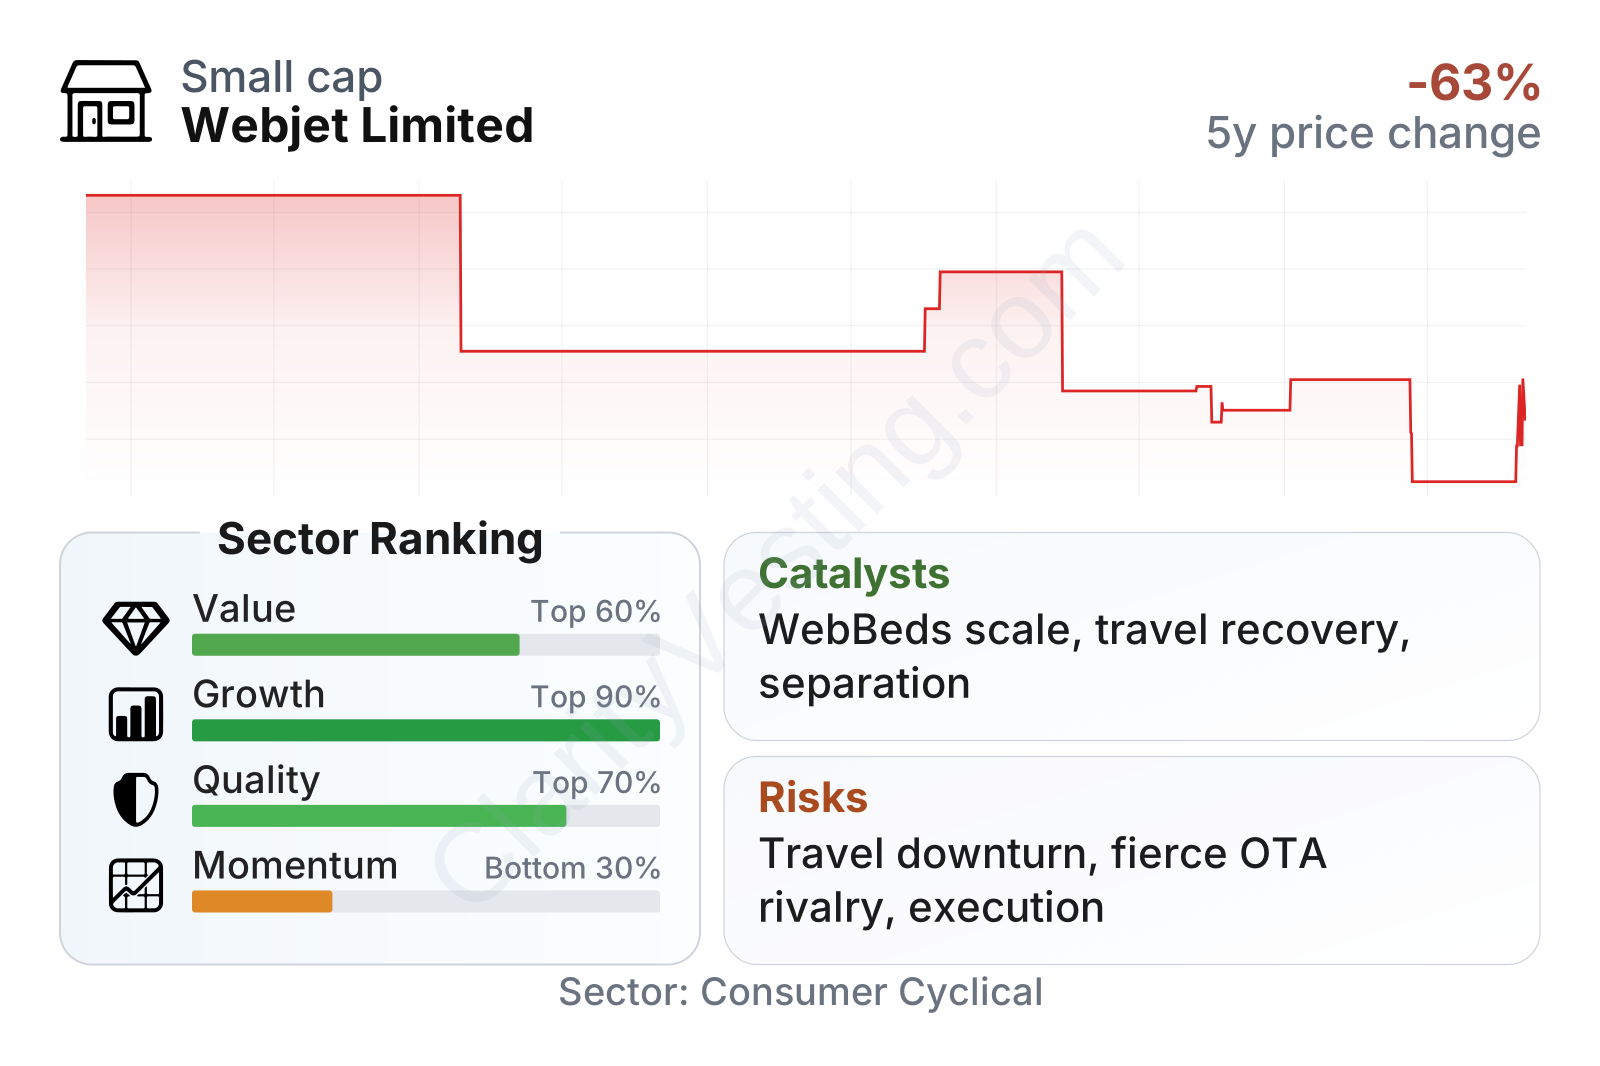
Webjet is a mid-sized travel services company with a stock price history that has been volatile. Over the last few years, the share performance has clearly lagged the broader consumer cyclical peer group, even though the operating business has posted strong growth and healthy cash generation. That disconnect matters: the market appears to be assigning caution to the company despite favorable margin and balance sheet characteristics.
The metrics table points to an unusual combination. Growth ranks near the top of the sector, helped by revenue growth of about 20% year over year, very strong five-year revenue-per-share expansion, and a sharp improvement in free cash flow over time. Quality is also solid, with operating margins well above the sector median, profit margins above peers, and a net cash position rather than heavy leverage. Debt-to-equity is moderate at about 44%, also below the sector median.
Valuation is less straightforward. The earnings multiple is well above the sector median, which can make the shares look expensive on a simple P/E basis. But price-to-book is roughly in line with peers, and free cash flow yield is stronger than the sector median, which suggests the market is not pricing Webjet like a premium growth platform across every measure. Momentum remains the weakest area, reflecting weak multi-year and recent price returns.
Growth
Webjet operates in a sector with long-term structural support. Global travel demand has expanded over time as more bookings move online, supply becomes more fragmented, and hotels increasingly rely on distributors that can reach thousands of agents and travel sellers efficiently. This supports Webjet’s positioning, especially in wholesale accommodation distribution where scale, connectivity, and supplier relationships matter.
The company’s strategy broadly makes sense for future growth. WebBeds benefits from network effects: more hotel supply attracts more travel buyers, and more buyers make the platform more valuable to suppliers. That can deepen relationships over time and improve margins if booking volumes keep increasing. In the consumer business, the Webjet brand remains relevant in Australia and New Zealand, giving the group a recognizable direct channel alongside its business-to-business operations.
A significant catalyst in recent years has been the continued normalization of international travel after the pandemic shock, especially in cross-border hotel bookings. Another important factor is operating leverage. When booking volumes rise, digital travel platforms can convert a meaningful part of incremental gross profit into operating earnings and cash flow. Webjet’s margin improvement over the past several years suggests this mechanism has been working.
Recent company developments also matter. Webjet has been pursuing a sharper strategic focus through portfolio changes and corporate restructuring, including actions around separating business lines to make each operation easier to assess on its own economics. If executed well, that can improve transparency, sharpen management focus, and potentially lead the market to value the underlying assets more distinctly than when they are bundled together.
Risks
This article is for informational purposes only and does not constitute financial advice. Some content is AI-generated. See Disclaimer