Stock Analysis · Naspers Ltd (NPSNY)
Overview
Naspers Ltd is a South Africa-based global consumer internet group. In practice, it is best understood as a holding company with stakes in digital platforms rather than a traditional single-brand operating business. Its portfolio spans classifieds, food delivery, payments and fintech, education technology, and e-commerce ventures, with its economic value still heavily influenced by its large ownership in Prosus and, through Prosus, the major stake in Tencent.
The group’s operating businesses are mainly assembled under Prosus, while Naspers itself sits above that structure. This means the investment case often depends on two layers at once: the performance of the underlying digital platforms and the gap between the market value of Naspers and the value of the assets it owns.
Based on recent annual reporting, the main revenue sources are centered on e-commerce operations rather than dividend income from listed investments.
- Classifieds — approximately 35% to 45% of operating revenue. This includes online marketplaces for autos, real estate, jobs, and secondhand goods, led by OLX and Avito-related activities.
- Food Delivery — approximately 25% to 35%. This includes iFood in Latin America and other delivery platforms where the group has meaningful ownership.
- Payments and Fintech — approximately 10% to 20%. This covers digital payments, credit, merchant services, and related financial tools in emerging markets.
- Etail and other e-commerce — approximately 5% to 15%. This includes online retail and other commerce activities across the portfolio.
- Edtech and other ventures — typically a smaller share, generally below the core businesses above.
The more important economic reality, however, is that asset value is still dominated by listed holdings, especially Tencent through Prosus. So while revenue comes from operating platforms, market perception often follows the value of the investment portfolio.
The business flow over the last several years shows a meaningful rise in revenue and gross profit, but also a much sharper swing in operating income than sales alone would suggest. That pattern fits a portfolio company with large fair-value movements, restructuring effects, and changing investment intensity rather than a smooth mature retailer.
Key Figures
| Metric | Value | Sector ⓘ |
|---|---|---|
| Date | Nov 04, 2026 | |
| Context | ||
| Sector | Consumer Cyclical | |
| Industry | Internet Retail | |
| Market Cap ⓘ | $31.31B | |
| Beta ⓘ | 0.65 | |
Value (Cheapness) | ||
| P/E Ratio ⓘ | 6.86 | 17.77 |
| P/B Ratio ⓘ | N/A | 1.68 |
| FCF Yield ⓘ | 10.54% | 8.69% |
| Dividend Yield ⓘ | N/A | 2.60% |
| EBIT / EV ⓘ | 22.88% | 6.54% |
| PEG ⓘ | 0.62 | |
Growth (Business expansion) | ||
| Revenue Growth ⓘ | 19.60% | 5.20% |
| RPS Growth (5Y CAGR) ⓘ | -10.51% | 9.01% |
| EPS Growth (5Y CAGR) ⓘ | -46.99% | -13.92% |
| BVPS Growth (5Y CAGR) ⓘ | N/A | 5.64% |
| Margin Growth (5Y Trend) ⓘ | -298.60% | -0.17% |
| FCF Growth (5Y CAGR) ⓘ | N/A | 5.51% |
| DPS Growth (5Y CAGR) ⓘ | -4.68% | 10.11% |
Quality (Business durability) | ||
| ROIC (Latest) ⓘ | 19.75% | 11.85% |
| ROA (Latest) ⓘ | 13.68% | 5.50% |
| ROIC (5Y Median) ⓘ | 28.56% | 10.58% |
| ROA (5Y Median) ⓘ | 6.54% | 5.37% |
| Net Debt / EBIT (Latest) ⓘ | 1.41 | 2.12 |
| Net Debt / EBIT (5Y Median) ⓘ | 0.78 | 2.27 |
| Net Debt / EBITDA (Latest) ⓘ | 1.29 | 1.45 |
| Net Debt / Assets ⓘ | 14.08% | 21.34% |
| EBITDA / Interest ⓘ | 5.30 | 9.78 |
| Operating Margin (Latest) ⓘ | 43.98% | 9.01% |
| Operating Margin (5Y Median) ⓘ | 172.27% | 9.57% |
| Debt to Equity (Latest) ⓘ | 77.41% | 75.07% |
| Profit Margin (Latest) ⓘ | 45.83% | 5.41% |
| Free Cash Flow (Latest) ⓘ | $3.30B | |
Momentum (Price trend) | ||
| 3Y Return ⓘ | +22.34% | +19.12% |
| 12M Return (excl. last month) ⓘ | -44.12% | -4.66% |
| 6M Return ⓘ | -21.68% | +1.16% |
| Price vs. 200-Day MA ⓘ | -18.84% | +0.65% |
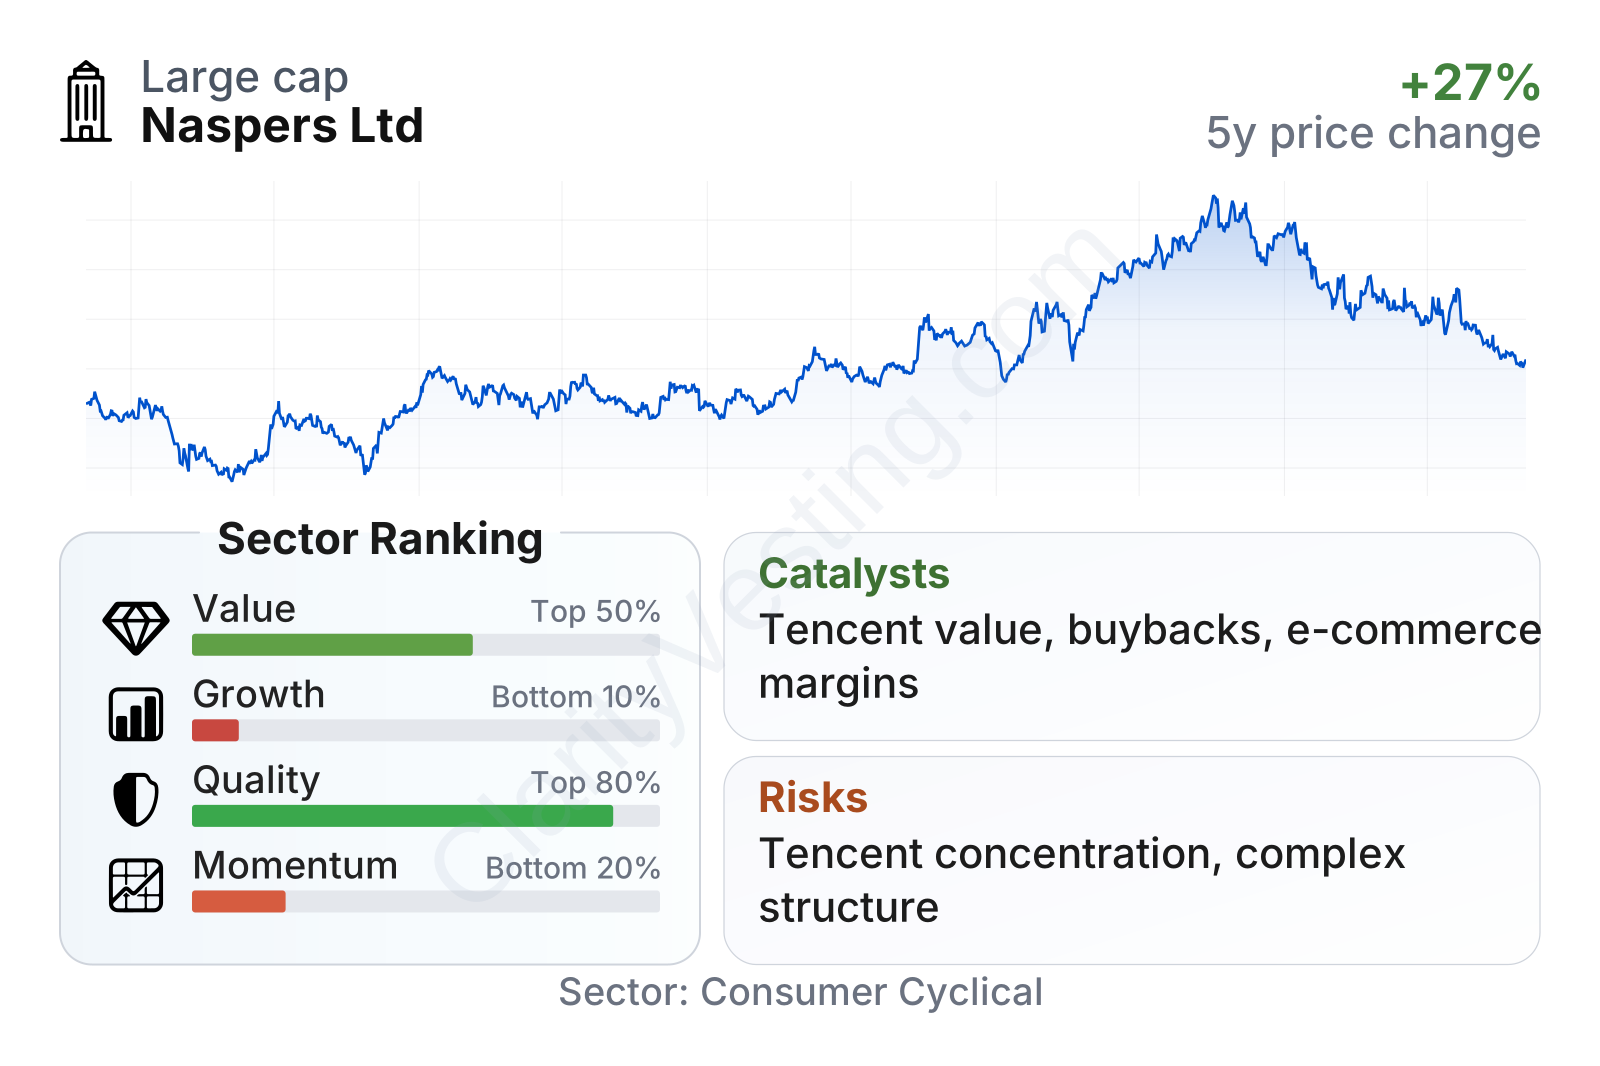
Naspers stands out as a large internet platform group with unusually strong profitability and cash generation metrics for its sector, while recent share-price momentum has been weak. The valuation factors look inexpensive relative to the broader consumer internet space, with a low earnings multiple, a free cash flow yield above the sector median, and a strong EBIT-to-enterprise-value ratio. Quality metrics are also notable: returns on capital and assets are well above median levels, while leverage appears manageable rather than stretched. The weak point is consistency of long-term growth per share, which helps explain why the market has not rewarded the stock with a higher multiple.
Growth
Naspers operates in sectors that still have long-term structural growth behind them: online classifieds continue to take share from offline channels, food delivery remains underpenetrated in many emerging markets, digital payments benefit from the shift away from cash, and online education and commerce still have room to expand. These are not short-lived themes. They are part of a wider consumer migration toward digital platforms, especially in regions where internet adoption is still rising.
The company’s strategy also makes sense on paper. Rather than relying on one app or one geography, it spreads capital across several platform categories where scale matters. Management has increasingly emphasized profitability, capital discipline, and simplification after years when investor concern was focused on the pace of spending. That change is important because digital platform groups usually create the most value when they move from pure expansion to expansion with better margins and cash conversion.
Recent revenue growth has been volatile, but the broader direction has improved. The latest year-over-year figure is still comfortably above the sector median, even though the longer five-year revenue-per-share record remains weak. In other words, current growth has reaccelerated, but the company is still rebuilding consistency after a choppy period.
Cash generation has also improved materially from negative territory to a solid positive level. That matters because it suggests some businesses in the portfolio are moving beyond the heavy investment phase. For a group like Naspers, stronger free cash flow can support debt management, selective reinvestment, and continued efforts to reduce the discount between asset value and market value.
A major catalyst remains the company’s exposure to Tencent through Prosus. Even though this is not the main source of operating revenue, it is central to underlying asset value. In addition, management has continued repurchase and capital-optimization efforts in recent years, which can help narrow the persistent holding-company discount if executed consistently. Another positive development is the stronger profitability profile emerging across several e-commerce assets, especially in classifieds and food delivery.
Recent company communications have also highlighted further simplification of the group structure and a continued push toward profitable growth. For a business long criticized for complexity, any credible move toward a cleaner structure can be a meaningful opportunity because it makes the company easier to understand and potentially easier for the market to value.
Risks
This article is for informational purposes only and does not constitute financial advice. Some content is AI-generated. See Disclaimer