Stock Analysis · Vtech Holdings Limited (VTKLF)
Overview
VTech Holdings Limited is a consumer electronics and communications equipment company best known for electronic learning toys, cordless phones, and outsourced manufacturing services. The group is headquartered in Hong Kong and sells globally, with a strong presence in North America and Europe. Its business is unusual because it combines consumer brands with a contract manufacturing operation, which gives it exposure to both household spending and business demand from third-party customers.
Based on the company’s latest annual report for the year ended March 31, 2026, revenue comes from three main operating segments:
- Electronic Learning Products: about 42% of revenue. This segment includes infant and preschool learning toys, kid-focused educational electronics, and interactive products sold under VTech and LeapFrog.
- Contract Manufacturing Services: about 34% of revenue. This business manufactures products for other companies, including professional audio equipment, IoT-related products, industrial products, and communication devices.
- Telecommunication Products: about 24% of revenue. This includes residential phones, baby monitors, commercial phones, and related communication systems.
The business mix matters for long-term analysis. Learning products bring consumer brand exposure, telecommunications adds recurring relevance in niche categories such as baby monitors and small-business phone systems, and contract manufacturing provides scale and customer diversification. At the same time, all three areas face pricing pressure and depend on steady product refreshes.
Over the last five fiscal years, revenue has drifted down from roughly $2.37 billion to about $2.02 billion. Even so, the company has remained profitable, and gross profit has held up better than sales because product mix and cost discipline partly offset weaker volume. That helps explain why VTech still converts a meaningful share of sales into cash despite muted top-line momentum.
The cost structure shows a business where manufacturing costs dominate, which is normal for hardware companies. Revenue has declined since 2022, but gross profit has been comparatively steadier, suggesting some resilience in pricing, mix, or sourcing efficiency. Operating profit and net income have narrowed more noticeably in the latest year, showing that lower sales are becoming harder to absorb.
Key Figures
| Metric | Value | Sector ⓘ |
|---|---|---|
| Date | Nov 04, 2026 | |
| Context | ||
| Sector | Technology | |
| Industry | Communication Equipment | |
| Market Cap ⓘ | $1.53B | |
| Beta ⓘ | 0.38 | |
Value (Cheapness) | ||
| P/E Ratio ⓘ | 11.42 | 27.60 |
| FCF Yield ⓘ | 18.75% | 4.23% |
| Dividend Yield ⓘ | 8.76% | 1.40% |
| EBIT / EV ⓘ | 23.06% | 3.00% |
| PEG ⓘ | N/A | |
Growth (Business expansion) | ||
| Revenue Growth ⓘ | -4.70% | 16.50% |
| RPS Growth (5Y CAGR) ⓘ | -4.06% | 8.55% |
| EPS Growth (5Y CAGR) ⓘ | -17.64% | -8.74% |
| Margin Growth (5Y Trend) ⓘ | 0.03% | 0.52% |
| FCF Growth (5Y CAGR) ⓘ | -2.91% | 9.82% |
| DPS Growth (5Y CAGR) ⓘ | -9.67% | 7.74% |
Quality (Business durability) | ||
| ROIC (Latest) ⓘ | 47.33% | 9.60% |
| ROIC (5Y Median) ⓘ | 24.74% | 8.32% |
| Net Debt / EBIT (Latest) ⓘ | -0.38 | 0.52 |
| Net Debt / EBIT (5Y Median) ⓘ | -0.79 | 0.46 |
| Net Debt / EBITDA (Latest) ⓘ | -0.29 | 0.28 |
| Net Debt / Assets ⓘ | -10.56% | 2.95% |
| EBITDA / Interest ⓘ | 46.53 | 13.46 |
| Operating Margin (Latest) ⓘ | 8.65% | 10.22% |
| Operating Margin (5Y Median) ⓘ | 8.65% | 8.51% |
| Debt to Equity (Latest) ⓘ | 19.59% | 32.45% |
| Profit Margin (Latest) ⓘ | 6.61% | 7.26% |
| Free Cash Flow (Latest) ⓘ | $287.32M | |
Momentum (Price trend) | ||
| 3Y Return ⓘ | +29.43% | +52.02% |
| 12M Return (excl. last month) ⓘ | -24.47% | +13.33% |
| 6M Return ⓘ | -23.37% | +5.13% |
| Price vs. 200-Day MA ⓘ | +3.38% | +2.72% |
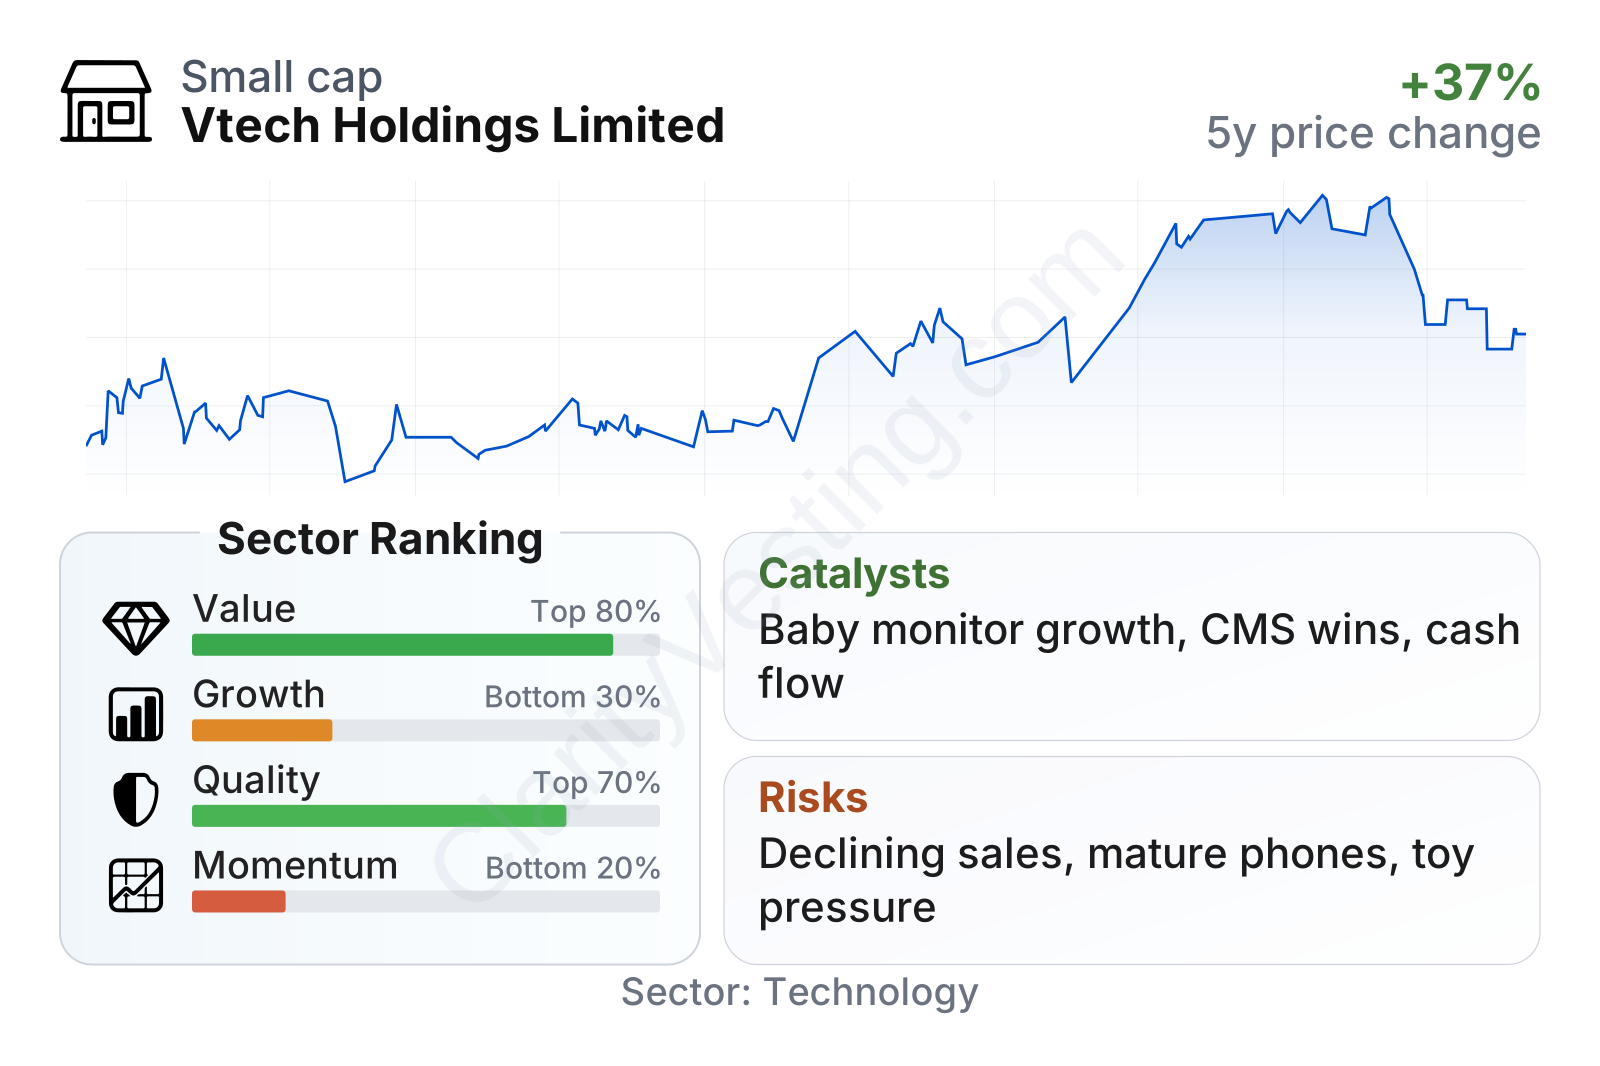
VTech stands out more for financial strength and cash generation than for growth. The company remains in the stronger part of the sector on value and quality measures, supported by a low earnings multiple, a high free-cash-flow yield, and a dividend yield far above the sector median. Balance sheet risk also looks limited: debt is modest, net cash remains positive, and interest coverage is very strong. The weaker areas are growth and share-price momentum, with revenue and earnings trends trailing most technology peers over both one-year and five-year periods.
The share price history reflects that mixed profile. The stock has advanced over several years but has been volatile, and recent performance has been softer than much of the sector. A low beta suggests the stock has historically moved less sharply than the broader market, which fits a mature, cash-generative business rather than a high-growth technology name.
Growth
VTech does not operate in the fastest-growing parts of the technology sector, but some of its niches still have durable demand. Educational toys continue to benefit from parents’ interest in screen-assisted learning, child-safe connected products, and recognized brands. Baby monitors also remain a steady category tied to household formation and premium features such as app connectivity, video, and monitoring functions. In contract manufacturing, demand can expand when customers outsource production to control costs and simplify supply chains.
The company’s strategy for future growth is sensible, though not especially aggressive. VTech continues to invest in product development, brand refreshes, and manufacturing capabilities. Its annual reports describe ongoing work in new learning platforms, LeapFrog integration, baby monitor innovation, and higher-value contract manufacturing categories such as professional audio and IoT-related devices. That strategy is coherent because it focuses on categories where the company already has distribution, engineering know-how, and manufacturing scale.
A useful catalyst is margin resilience rather than rapid sales expansion. Even with revenue pressure, VTech has continued to generate strong free cash flow, which can support dividends, product development, and selective business investment. Another potential opportunity comes from easing freight and input-cost pressures compared with the peak disruption period of recent years, although those benefits can be offset by softer demand.
Recent company reporting for fiscal 2026 showed revenue declining year over year, mainly because of weaker demand in electronic learning products and telecommunication products. That is not the kind of news that changes the growth outlook immediately. The more constructive angle is that contract manufacturing remains a meaningful platform for winning programs in specialized categories, and the company still has the financial flexibility to endure slow periods while refreshing its portfolio.
Risks
This article is for informational purposes only and does not constitute financial advice. Some content is AI-generated. See Disclaimer