Stock Analysis · WEC Energy Group Inc (WEC)
Overview
WEC Energy Group is a large regulated utility serving customers mainly in Wisconsin, Illinois, Michigan, and Minnesota. Its business is built around delivering electricity and natural gas to homes, businesses, and industrial customers through local utility subsidiaries. It also owns a smaller non-utility energy infrastructure business. For a long-term reader, the key point is simple: this is not a fast-changing technology company, but a highly regulated provider of essential services with earnings that usually depend on customer demand, approved rates, and capital investment plans.
The company’s revenue mix is still dominated by regulated operations. Based on recent annual reporting, the broad sources of revenue can be summarized approximately as follows:
- Electric utility operations: about 55% to 60% — retail and wholesale electricity sales, including transmission-related revenue and other regulated electric services.
- Natural gas utility operations: about 35% to 40% — gas distribution to residential, commercial, and industrial customers, plus related regulated service charges.
- Other and non-utility energy infrastructure: about 3% to 8% — renewable investments, pipeline and storage interests, and smaller miscellaneous operations.
That mix matters because regulated utility revenue is usually steadier than most industries, but it also means growth tends to be gradual rather than explosive. Another useful point is that revenue can move around from year to year because fuel and purchased power costs pass through customer bills, so earnings and allowed returns often tell more than raw sales alone.
Over the last several years, total revenue has moved up and down, while operating income and net income have held up better. That pattern suggests the company has been managing costs and preserving profitability even in a period with changing energy prices. Interest expense has also been rising, which is important because utilities depend heavily on borrowed money to fund large infrastructure programs.
Key Figures
| Metric | Value | Sector ⓘ |
|---|---|---|
| Date | Oct 17, 2026 | |
| Context | ||
| Sector | Utilities | |
| Industry | Utilities - Regulated Electric | |
| Market Cap ⓘ | $34.50B | |
| Beta ⓘ | 0.44 | |
Value (Cheapness) | ||
| P/E Ratio ⓘ | 20.56 | 17.28 |
| P/B Ratio ⓘ | 2.56 | 1.51 |
| FCF Yield ⓘ | -4.06% | 0.65% |
| Dividend Yield ⓘ | 3.52% | 3.77% |
| EBIT / EV ⓘ | 4.64% | 5.01% |
| PEG ⓘ | 1.99 | |
Growth (Business expansion) | ||
| Revenue Growth ⓘ | 2.60% | 6.10% |
| RPS Growth (5Y CAGR) ⓘ | 3.26% | 3.87% |
| EPS Growth (5Y CAGR) ⓘ | -7.28% | -11.30% |
| BVPS Growth (5Y CAGR) ⓘ | 4.41% | 4.23% |
| Margin Growth (5Y Trend) ⓘ | 2.52% | 3.57% |
| FCF Growth (5Y CAGR) ⓘ | N/A | -8.84% |
| DPS Growth (5Y CAGR) ⓘ | 6.68% | 4.84% |
Quality (Business durability) | ||
| ROIC (Latest) ⓘ | 6.81% | 6.53% |
| ROA (Latest) ⓘ | 3.30% | 3.20% |
| ROIC (5Y Median) ⓘ | 6.67% | 5.95% |
| ROA (5Y Median) ⓘ | 3.35% | 2.75% |
| Net Debt / EBIT (Latest) ⓘ | 8.83 | 7.13 |
| Net Debt / EBIT (5Y Median) ⓘ | 7.93 | 7.23 |
| Net Debt / EBITDA (Latest) ⓘ | 5.58 | 4.31 |
| Net Debt / Assets ⓘ | 43.47% | 38.42% |
| EBITDA / Interest ⓘ | 4.52 | 4.58 |
| Operating Margin (Latest) ⓘ | 25.61% | 20.83% |
| Operating Margin (5Y Median) ⓘ | 25.45% | 20.08% |
| Debt to Equity (Latest) ⓘ | 162.57% | 137.69% |
| Profit Margin (Latest) ⓘ | 16.69% | 11.37% |
| Free Cash Flow (Latest) ⓘ | -$1.40B | |
Momentum (Price trend) | ||
| 3Y Return ⓘ | +44.03% | +52.37% |
| 12M Return (excl. last month) ⓘ | -1.59% | +8.84% |
| 6M Return ⓘ | -6.78% | -3.95% |
| Price vs. 200-Day MA ⓘ | -2.85% | -0.79% |
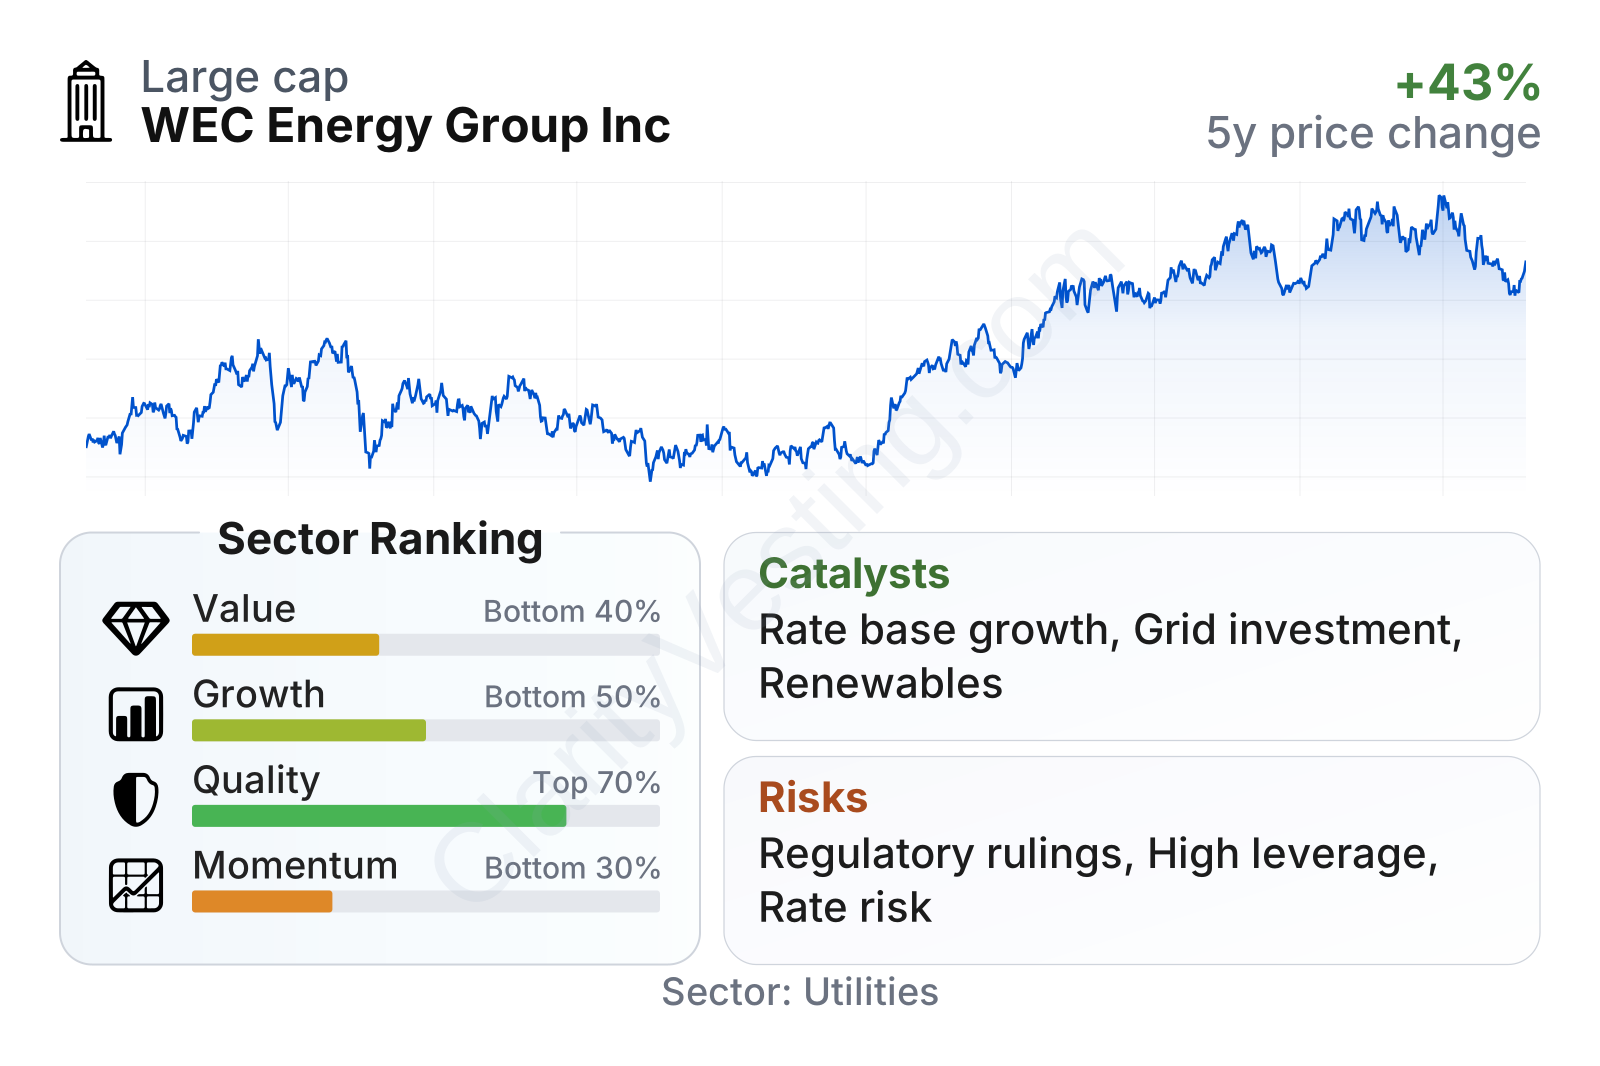
WEC is a large utility with relatively low share-price volatility, as shown by a beta well below 1. In the broader utility group, its quality profile looks stronger than average, especially on profitability measures such as operating margin and profit margin. Growth, however, appears more modest, and valuation is not especially cheap compared with the sector. The balance sheet shows above-median leverage, which is common in utilities but still worth close attention when interest rates stay elevated.
Growth
WEC operates in a sector that is structurally supported by long-term demand for reliable electricity, grid modernization, natural gas distribution, and cleaner generation. Utilities are not usually judged by rapid sales expansion, but by whether they can keep investing in their systems, earn approved returns on that investment, and grow earnings steadily over time. In that context, WEC’s strategy is broadly aligned with the sector’s main growth drivers: transmission spending, renewable generation, reliability upgrades, and replacement of aging infrastructure.
The company’s medium-term growth case is tied less to volume growth and more to its capital plan. When a regulated utility builds or upgrades assets that regulators include in rate base, those investments can support future earnings. This is one of the main reasons utilities often continue growing even when customer usage is fairly stable. WEC has also emphasized electric reliability, cleaner generation, and gas system safety, all of which fit the direction of utility regulation in its service territories.
Revenue per share has trended upward over a five-year view, although not in a straight line. That is fairly normal for a utility, where weather, fuel recovery mechanisms, and rate timing can affect annual comparisons. The more important takeaway is that the company has still managed to expand per-share revenue over time, but at a pace that looks moderate rather than standout compared with many peers.
Free cash flow has been volatile and recently negative, which is common when utilities are deep into investment cycles. Negative free cash flow does not automatically indicate weakness here; it often reflects heavy spending on infrastructure that management expects to recover through future regulated returns. Still, it means growth depends on continued access to debt and equity capital at workable costs.
A relevant catalyst for the coming years is the broad electrification and grid investment theme across the U.S. economy. Data centers, industrial reshoring, grid hardening, and renewable integration all tend to require more transmission and distribution spending. If WEC continues winning regulatory support for those projects, that can create a durable runway for earnings and dividend growth. Public company updates in 2026 have continued to point toward infrastructure investment and constructive utility execution rather than a major change in direction.
Risks
This article is for informational purposes only and does not constitute financial advice. Some content is AI-generated. See Disclaimer


