Stock Analysis · Walker & Dunlop Inc (WD)
Overview
Walker & Dunlop is a commercial real estate finance company. In simple terms, it helps property owners and developers get loans, especially for apartment buildings, affordable housing, industrial properties, and other income-producing real estate. The company also earns fees from servicing those loans over time, sells loans into the capital markets, and operates small but growing businesses in investment sales, appraisal, and property technology.
Its business model is centered on being an intermediary: it originates loans for borrowers, works with large capital providers such as Fannie Mae, Freddie Mac, HUD, banks, and life insurers, and then keeps earning recurring servicing income on many of those loans after closing. That makes Walker & Dunlop more than a one-time loan broker, although loan origination volumes still have a large influence on results.
Based on recent company filings, the main revenue sources are approximately the following:
- Gains from mortgage banking activities: about 50% to 60%. This is mainly income earned when the company originates loans and sells them or transfers them into agency programs.
- Servicing fees: about 20% to 30%. This is recurring income from administering loans after origination, including collecting payments and managing loan-related activity.
- Net warehouse interest income and placement fees: about 10% to 20%. This includes earnings tied to interim loan funding and certain capital markets activities.
- Asset management, appraisal, brokerage, and other fees: usually less than 10%. These activities add diversification but remain smaller than the core lending and servicing operations.
That mix matters for long-term analysis. Origination-related income can swing sharply with real estate activity and interest rates, while servicing revenue is steadier and gives the company a more durable earnings base.
The business has remained capable of generating more than $1 billion in annual revenue in recent years, but profitability has become much thinner than it was in 2021 and 2022. Revenue recovered in 2025, yet net income stayed far below earlier peak levels, showing that scale alone has not fully restored earnings power.
Key Figures
| Metric | Value | Sector ⓘ |
|---|---|---|
| Date | Oct 17, 2026 | |
| Context | ||
| Sector | Financial Services | |
| Industry | Mortgage Finance | |
| Market Cap ⓘ | $1.10B | |
| Beta ⓘ | 1.51 | |
Value (Cheapness) | ||
| P/E Ratio ⓘ | 28.62 | 12.26 |
| P/B Ratio ⓘ | 0.65 | 1.23 |
| FCF Yield ⓘ | -116.08% | 10.40% |
| Dividend Yield ⓘ | 8.42% | 3.02% |
| EBIT / EV ⓘ | 2.87% | 8.14% |
| PEG ⓘ | 1.09 | |
Growth (Business expansion) | ||
| Revenue Growth ⓘ | -10.00% | 9.35% |
| RPS Growth (5Y CAGR) ⓘ | -1.90% | 12.19% |
| EPS Growth (5Y CAGR) ⓘ | -24.61% | -9.53% |
| BVPS Growth (5Y CAGR) ⓘ | 1.21% | 4.99% |
| Margin Growth (5Y Trend) ⓘ | -16.86% | -3.86% |
| FCF Growth (5Y CAGR) ⓘ | N/A | 4.81% |
| DPS Growth (5Y CAGR) ⓘ | 7.71% | 8.79% |
Quality (Business durability) | ||
| ROIC (Latest) ⓘ | 1.56% | 9.49% |
| ROE (Latest) ⓘ | 2.27% | 13.90% |
| ROA (Latest) ⓘ | 0.76% | 1.55% |
| ROIC (5Y Median) ⓘ | 3.41% | 7.86% |
| ROE (5Y Median) ⓘ | 6.17% | 12.17% |
| ROA (5Y Median) ⓘ | 2.65% | 1.30% |
| Net Debt / EBIT (Latest) ⓘ | 21.22 | 0.96 |
| Net Debt / EBIT (5Y Median) ⓘ | 8.29 | 0.73 |
| Net Debt / EBITDA (Latest) ⓘ | 5.98 | 0.92 |
| Operating Margin (Latest) ⓘ | 7.63% | 22.30% |
| Operating Margin (5Y Median) ⓘ | 13.06% | 24.63% |
| Debt to Equity (Latest) ⓘ | 129.18% | 58.56% |
| Profit Margin (Latest) ⓘ | 3.28% | 26.57% |
| Free Cash Flow (Latest) ⓘ | -$1.28B | |
Momentum (Price trend) | ||
| 3Y Return ⓘ | -46.09% | +88.33% |
| 12M Return (excl. last month) ⓘ | -50.14% | +19.38% |
| 6M Return ⓘ | -29.90% | +4.75% |
| Price vs. 200-Day MA ⓘ | -30.87% | +3.50% |
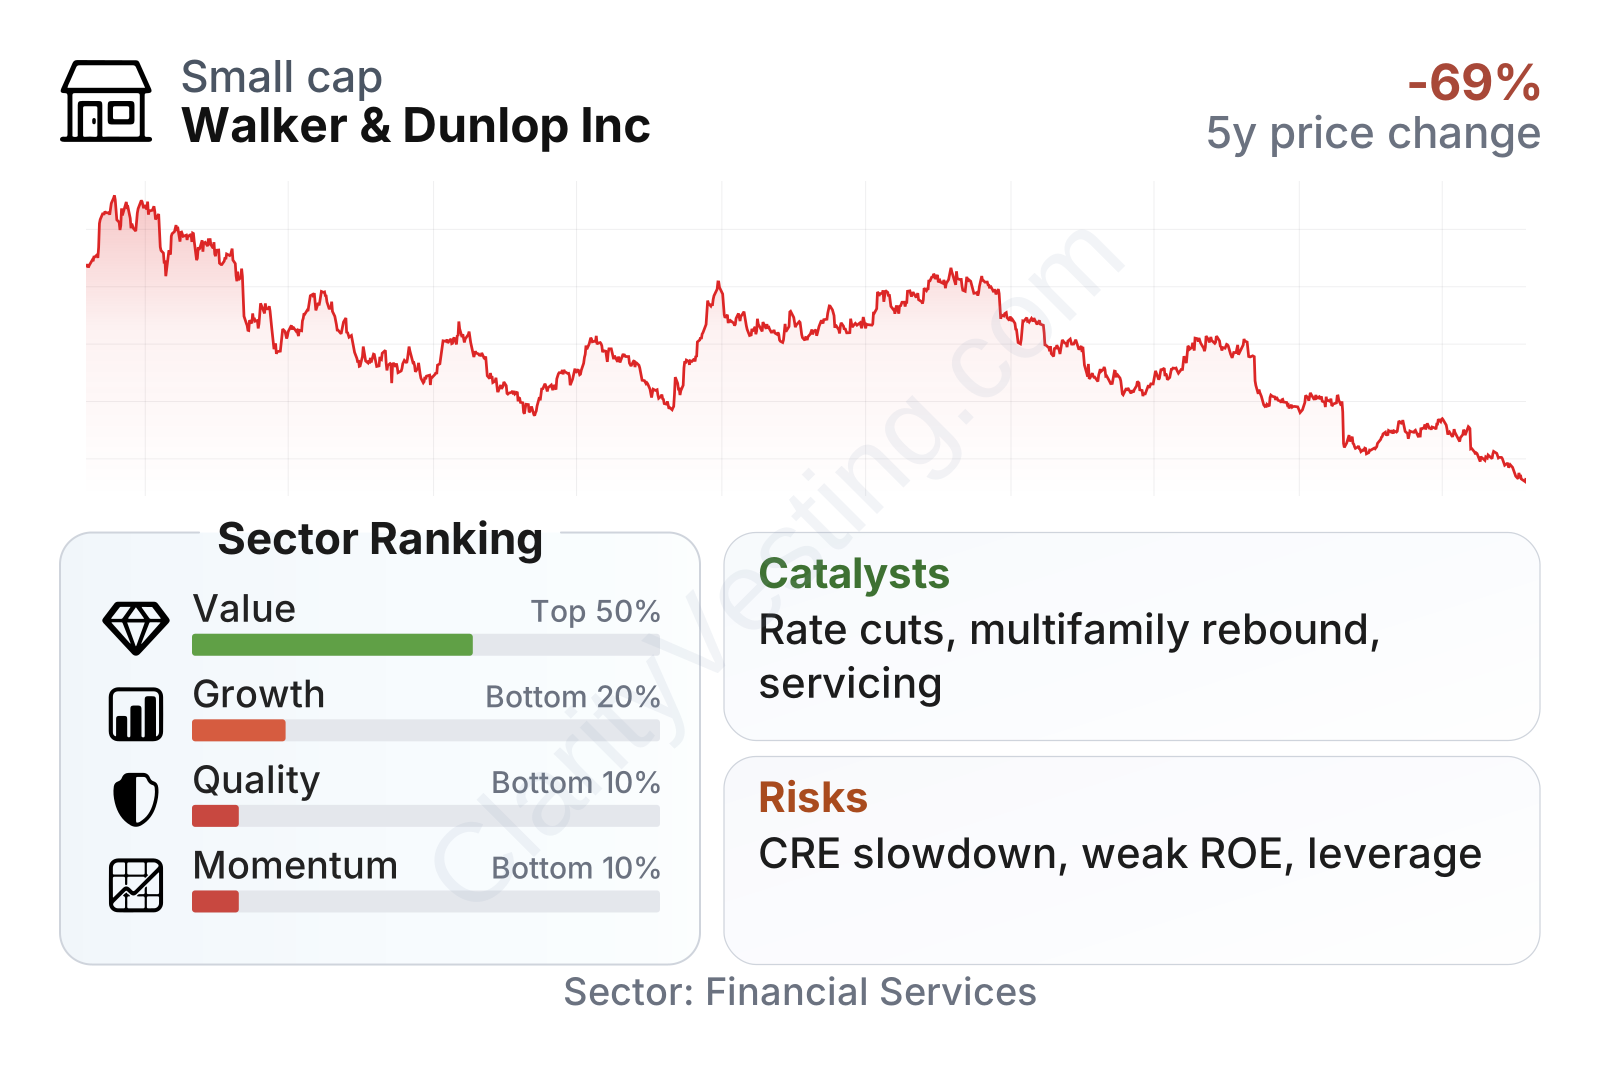
Walker & Dunlop is a mid-sized company in financial services, and its market behavior has been notably volatile, with a beta above 1.4. The stock has fallen heavily from its 2022 high and has remained weak versus the broader financial sector over the last several years. In the factor breakdown, value looks mixed rather than clearly cheap or expensive: the dividend yield is high, and the price-to-book ratio is below the sector median, but earnings-based valuation is elevated and free cash flow is negative. Quality, growth, and momentum all screen poorly versus peers, which reflects margin pressure, weak recent returns, and a difficult operating environment rather than a simple one-number problem.
Growth
Walker & Dunlop operates in a sector that still has long-term structural support. Commercial and multifamily real estate financing is tied to basic needs such as housing, logistics space, and property refinancing. In particular, multifamily housing and affordable housing remain areas with durable demand drivers in the United States. The company has built its franchise around those segments, which gives it exposure to parts of real estate that tend to matter across cycles.
Its strategy for future growth is logical. Management has spent years building scale in agency lending, servicing, capital markets, and related advisory services. The servicing portfolio is especially important because it can provide recurring fee income even when new loan originations slow. The company has also expanded into investment sales, appraisal, and technology-related real estate services, aiming to reduce reliance on pure transaction volume over time.
A major catalyst is the direction of interest rates. When rates stabilize or decline, refinancing activity, property transactions, and debt placement usually improve. That can create a meaningful rebound in origination fees for a company like Walker & Dunlop. Another catalyst is the company’s long-standing position with Fannie Mae, Freddie Mac, and HUD programs, which are important funding channels for multifamily and affordable housing finance.
The earnings pattern shows why the long-term case depends on recovery rather than uninterrupted expansion. Earnings per share were very strong in 2021, then fell sharply as higher rates and weaker transaction activity hit the commercial real estate market. There was some improvement in 2024, but the broader trend remains below prior peak levels. This means future growth likely depends more on a cyclical normalization in loan volumes and margins than on momentum already in place.
Book value per share has been relatively stable over the last several years, with only modest growth overall. That stability suggests the balance sheet has not been severely eroded despite weaker earnings, but it also shows that internal compounding has slowed considerably. For long-term analysis, that points to a business that has preserved capital better than it has expanded it.
Recent company communications have continued to emphasize multifamily lending, affordable housing, servicing growth, and broader capital markets capabilities. Those areas appear to offer the clearest path to a stronger earnings base if real estate financing conditions improve.
Risks
This article is for informational purposes only and does not constitute financial advice. Some content is AI-generated. See Disclaimer


