Stock Analysis · West China Cement Limited (WCHNF)
Overview
West China Cement Limited is a building materials company focused mainly on cement and related products used in infrastructure, real estate, and public works. The group started in western China and later expanded into other markets, especially in Africa. Its business is tied to basic construction demand: roads, bridges, housing, industrial sites, and government-led projects all influence volumes and pricing.
The company’s revenue base is still centered on cement production and sales, with additional contributions from downstream construction materials and services. Public disclosures and company materials indicate that the business mix is dominated by cement and clinker, while concrete and other related activities make up a smaller share.
- Cement and clinker: approximately 70% to 85% of revenue. This is the core activity and includes the manufacturing and sale of the main binding materials used in construction.
- Ready-mixed concrete and aggregates: approximately 10% to 20% of revenue. These products are sold to construction projects that need processed building materials rather than raw cement alone.
- Other activities: approximately 5% to 10% of revenue. This can include trading, logistics, and other supporting operations depending on the reporting period and consolidation scope.
The business profile matters because cement is heavy, expensive to transport over long distances, and highly local. That means plant location, access to limestone, energy costs, and proximity to demand centers are more important than brand power. For West China Cement, that creates a practical advantage where it already has established production assets and regional distribution, but it also means performance depends heavily on local construction cycles.
The company’s financial flow over the last several years shows a business that remained profitable at the operating level even while earnings moved around sharply. Revenue rose from roughly 8.0 billion to 9.4 billion over 2021 to 2025, but profit conversion was less stable because costs, financing charges, and market conditions consumed a large part of that improvement.
The operating picture suggests a company with solid industrial scale and resilient gross profitability, but with meaningful pressure from interest expense and uneven bottom-line results. That combination is common in cyclical, asset-heavy building materials businesses.
Key Figures
| Metric | Value | Sector ⓘ |
|---|---|---|
| Date | Oct 17, 2026 | |
| Context | ||
| Sector | Basic Materials | |
| Industry | Building Materials | |
| Market Cap ⓘ | $1.26B | |
| Beta ⓘ | 0.95 | |
Value (Cheapness) | ||
| P/E Ratio ⓘ | 7.68 | 16.90 |
| P/B Ratio ⓘ | 0.17 | 1.65 |
| FCF Yield ⓘ | -156.26% | 5.76% |
| Dividend Yield ⓘ | 13.71% | 2.13% |
| EBIT / EV ⓘ | N/A | 6.30% |
| PEG ⓘ | N/A | |
Growth (Business expansion) | ||
| Revenue Growth ⓘ | -16.50% | 11.10% |
| RPS Growth (5Y CAGR) ⓘ | 3.95% | 4.49% |
| EPS Growth (5Y CAGR) ⓘ | -15.78% | -13.47% |
| BVPS Growth (5Y CAGR) ⓘ | 0.12% | 5.51% |
| Margin Growth (5Y Trend) ⓘ | -12.17% | -1.54% |
| FCF Growth (5Y CAGR) ⓘ | -9.86% | 0.37% |
| DPS Growth (5Y CAGR) ⓘ | -27.19% | 6.08% |
Quality (Business durability) | ||
| ROIC (Latest) ⓘ | N/A | 9.26% |
| ROA (Latest) ⓘ | 3.48% | 4.91% |
| ROIC (5Y Median) ⓘ | 5.24% | 7.70% |
| ROA (5Y Median) ⓘ | 2.40% | 3.86% |
| Net Debt / EBIT (Latest) ⓘ | 4.09 | 1.40 |
| Net Debt / EBIT (5Y Median) ⓘ | 6.53 | 1.70 |
| Net Debt / EBITDA (Latest) ⓘ | 2.82 | 0.95 |
| Net Debt / Assets ⓘ | 27.08% | 13.69% |
| EBITDA / Interest ⓘ | 3.82 | 12.34 |
| Operating Margin (Latest) ⓘ | 17.09% | 13.20% |
| Operating Margin (5Y Median) ⓘ | 17.12% | 11.80% |
| Debt to Equity (Latest) ⓘ | 99.30% | 40.56% |
| Profit Margin (Latest) ⓘ | 5.84% | 6.43% |
| Free Cash Flow (Latest) ⓘ | -$1.97B | |
Momentum (Price trend) | ||
| 3Y Return ⓘ | +261.20% | +68.89% |
| 12M Return (excl. last month) ⓘ | +51.91% | +30.21% |
| 6M Return ⓘ | 0.00% | -4.16% |
| Price vs. 200-Day MA ⓘ | 0.00% | -1.27% |
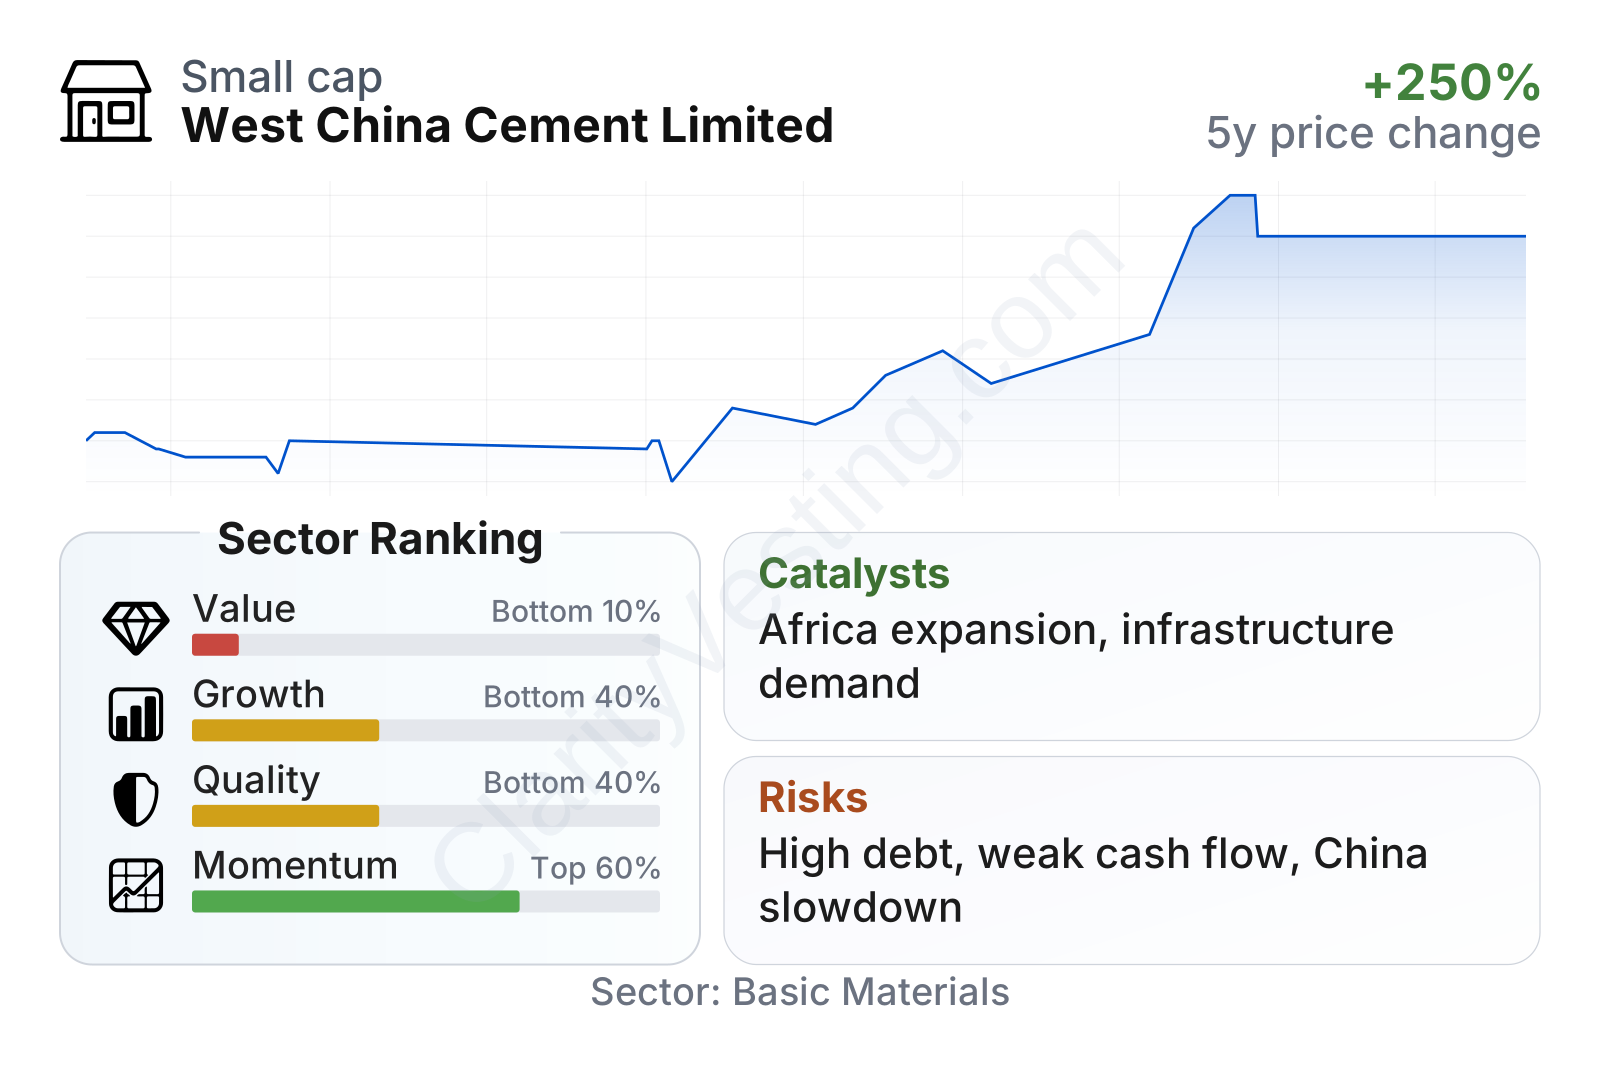
The overall profile is mixed. On valuation, West China Cement screens as very cheap versus much of the building materials sector, with a low earnings multiple and an extremely low price-to-book ratio. The dividend yield is also unusually high. However, those low multiples come with clear offsets: free cash flow is currently negative, leverage is elevated, and growth indicators trail sector medians in several areas.
Profitability is not weak in an absolute sense. Operating margin is above the sector median, both on a trailing basis and over a five-year view, which suggests the company’s plants and market footprint can still produce acceptable industrial returns before financing costs. The problem is that debt is much heavier than the sector norm. Net debt relative to EBIT and EBITDA is high, debt-to-equity is close to 100%, and interest coverage is much lower than typical peers. In simple terms, the business appears more burdened by its capital structure than by its core operating model.
The stock’s longer-term market performance has been strong compared with many sector names, especially over three years, but recent movement looks flatter. That can happen when a stock rerates sharply and then pauses while the market waits for clearer evidence on earnings quality, cash generation, or debt improvement.
Growth
Cement is not a fast-growth industry in the usual sense, but it can still offer long-duration demand when a company is exposed to regions with infrastructure deficits and urban development needs. This is where West China Cement’s positioning becomes more interesting. Mature Chinese cement markets face slower structural demand, pricing pressure, and overcapacity concerns, while African markets can offer better long-term volume potential driven by population growth, urbanization, and lower per-capita cement consumption.
That strategic direction makes industrial sense. A producer with operating know-how, quarry access, and plant-building experience can potentially redeploy capital from slower markets into regions where basic materials demand has a longer runway. If execution is disciplined, this can create a more balanced portfolio across geographies instead of relying too heavily on one construction cycle.
Recent revenue progression also shows that the company has not been shrinking outright over the medium term. Sales increased from around 8 billion in 2021 to more than 9 billion in 2025. Even so, the latest year-over-year revenue trend in the metrics is negative, which means growth remains uneven rather than consistently compounding. In other words, the expansion case depends more on project pipeline, geographic mix, and margin resilience than on a straight-line growth pattern.
One useful catalyst is any acceleration in public infrastructure spending in the regions where the company operates. Cement demand tends to respond directly to roads, industrial parks, water projects, and large housing programs. Another is balance-sheet stabilization: if operating income remains healthy and financing pressure eases, more of the company’s revenue could flow through to net profit and cash generation. The improvement in net income from 2023 to 2025, after a deep drop in 2023, hints that earnings can recover when conditions are less adverse.
A second catalyst is the company’s ability to keep operating margins above sector medians. In a commodity-like industry, sustained margin outperformance usually points to decent plant efficiency, cost control, or favorable local market structure. If those strengths persist while volumes recover, earnings leverage could be meaningful.
Risks
This article is for informational purposes only and does not constitute financial advice. Some content is AI-generated. See Disclaimer


