Stock Analysis · WaterBridge Infrastructure LLC (WBI)
Overview
WaterBridge Infrastructure LLC operates water infrastructure systems that support oil and gas production, especially in the Permian Basin. In simple terms, the company helps energy producers secure, move, recycle, store, and dispose of water used in drilling and production. That makes WaterBridge less exposed to direct oil and gas price swings than exploration companies, but still closely tied to drilling activity and customer demand in key shale regions.
The business model is built around long-lived infrastructure assets such as pipelines, gathering systems, disposal wells, recycling facilities, and related water handling networks. These assets are typically connected to customer acreage under contracts that can provide recurring revenue over time.
Based on company disclosures, WaterBridge’s revenue is primarily tied to produced water gathering, transportation, disposal, recycling, and freshwater handling services. Public filings do not always break out every line item with exact percentages in a simple segment table, but the business mix can be summarized as follows:
- Produced water gathering, transportation, and disposal: the largest revenue source, incorporating pipeline takeaway and disposal solutions for water that comes out of oil and gas wells alongside hydrocarbons.
- Water recycling and reuse: treatment and recycling services that allow customers to reuse produced water in future completions, an area growing in importance as operators seek lower-cost and more sustainable water management.
- Freshwater sourcing and distribution: supply and delivery of water used in hydraulic fracturing and other field operations.
- Other infrastructure-related and service revenues: smaller contributions that may include ancillary fees, storage, and contract-specific services.
What stands out is the scale change over the last few years. Revenue expanded sharply from 2023 to 2024, then remained at a much higher level in 2025 than in 2023. Operating income also improved over that stretch, suggesting the asset base has become significantly larger even though bottom-line earnings remained constrained by financing costs.
The business became much larger between 2023 and 2025, and operating profit improved, but interest expense absorbed a large share of those gains. That helps explain why strong revenue growth has not translated into equally strong net income or free cash flow.
Key Figures
| Metric | Value | Sector ⓘ |
|---|---|---|
| Date | Oct 17, 2026 | |
| Context | ||
| Sector | Energy | |
| Industry | Oil & Gas Equipment & Services | |
| Market Cap ⓘ | $3.80B | |
| Beta ⓘ | N/A | |
Value (Cheapness) | ||
| P/E Ratio ⓘ | 385.12 | 15.44 |
| P/B Ratio ⓘ | 1.70 | 1.73 |
| FCF Yield ⓘ | -3.22% | 8.20% |
| Dividend Yield ⓘ | 0.33% | 3.59% |
| EBIT / EV ⓘ | 3.26% | 7.46% |
| PEG ⓘ | N/A | |
Growth (Business expansion) | ||
| Revenue Growth ⓘ | 128.00% | 26.90% |
| RPS Growth (5Y CAGR) ⓘ | 53.22% | 6.90% |
| EPS Growth (5Y CAGR) ⓘ | N/A | -15.73% |
| BVPS Growth (5Y CAGR) ⓘ | -8.85% | 6.07% |
| Margin Growth (5Y Trend) ⓘ | -3.33% | 0.58% |
| FCF Growth (5Y CAGR) ⓘ | N/A | 1.86% |
| DPS Growth (5Y CAGR) ⓘ | N/A | 16.79% |
Quality (Business durability) | ||
| ROIC (Latest) ⓘ | 4.33% | 11.40% |
| ROA (Latest) ⓘ | 0.39% | 6.06% |
| ROIC (5Y Median) ⓘ | N/A | 10.30% |
| ROA (5Y Median) ⓘ | N/A | 5.42% |
| Net Debt / EBIT (Latest) ⓘ | 14.97 | 1.64 |
| Net Debt / EBIT (5Y Median) ⓘ | N/A | 1.83 |
| Net Debt / EBITDA (Latest) ⓘ | 4.54 | 1.08 |
| Net Debt / Assets ⓘ | 39.84% | 17.29% |
| EBITDA / Interest ⓘ | 3.95 | 9.64 |
| Operating Margin (Latest) ⓘ | 13.95% | 16.27% |
| Operating Margin (5Y Median) ⓘ | 17.09% | 20.39% |
| Debt to Equity (Latest) ⓘ | 212.72% | 54.76% |
| Profit Margin (Latest) ⓘ | 1.42% | 8.82% |
| Free Cash Flow (Latest) ⓘ | -$122.30M | |
Momentum (Price trend) | ||
| 3Y Return ⓘ | N/A | +67.38% |
| 12M Return (excl. last month) ⓘ | N/A | +49.19% |
| 6M Return ⓘ | +15.33% | +7.07% |
| Price vs. 200-Day MA ⓘ | +4.84% | +9.56% |
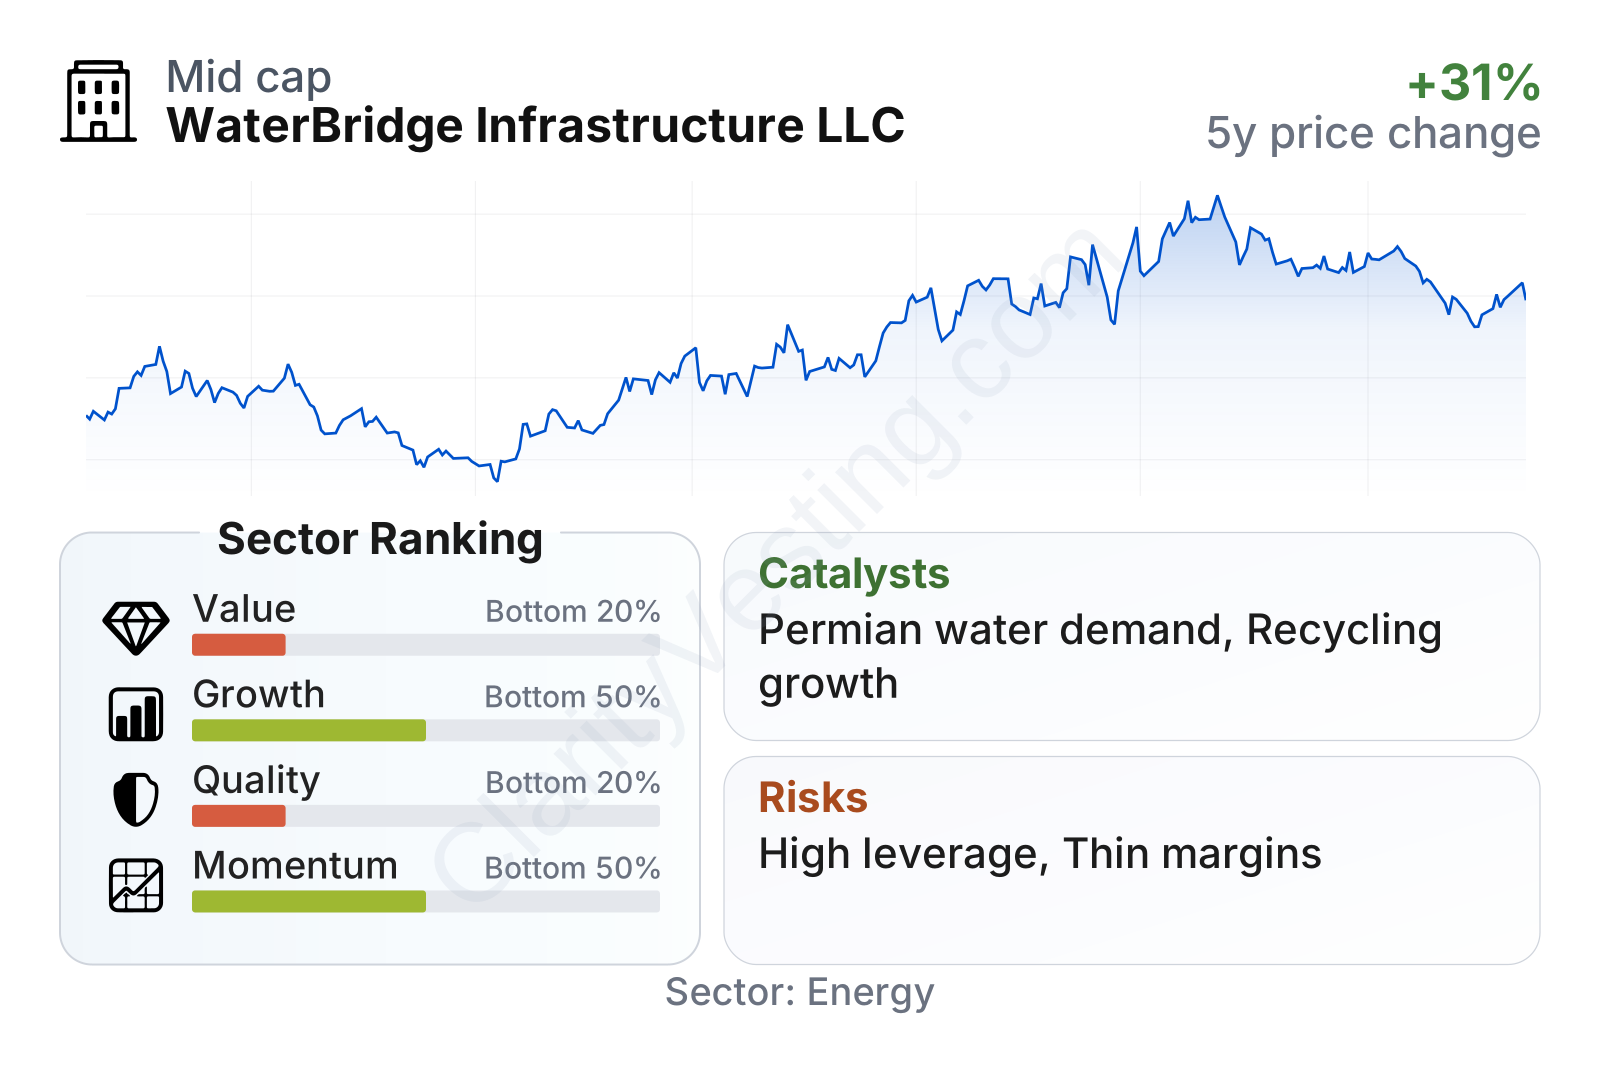
WaterBridge is a mid-sized energy infrastructure company by market value, but its factor profile is uneven. Growth has been exceptionally strong on revenue measures, far above the sector median over both one year and five years. However, quality and value metrics rank weakly versus peers, mainly because leverage is high, free cash flow is negative, returns on capital are modest, and profitability after interest remains thin. Momentum has been mixed: the stock advanced strongly over the past year, although recent positioning versus longer-term averages is not especially strong compared with the broader energy group.
Growth
Water management in U.S. shale is part of a sector with durable underlying demand. As wells mature, they often produce more water relative to oil and gas, which increases the need for gathering, transportation, treatment, recycling, and disposal infrastructure. In major basins such as the Permian, this creates an ongoing need for specialized midstream-style water systems rather than one-time service work.
WaterBridge’s strategy fits that trend. The company focuses on integrated infrastructure in concentrated producing regions, where scale matters. Once pipelines, disposal wells, and recycling systems are built and connected to customer operations, they can become difficult and costly to replace. That can support recurring volumes and make additional expansions more attractive because the company can grow around an existing network instead of starting from scratch.
A second growth driver is water recycling. Producers increasingly want to reduce freshwater use and lower the cost of transporting and disposing of produced water. Recycling infrastructure can address both goals at once. If customer demand for reuse continues to grow, WaterBridge could benefit not only from handling larger total volumes but also from offering a broader mix of services on the same footprint.
The recent operating profile also points to real commercial progress. Revenue growth remains far ahead of the sector median, which suggests either major volume additions, expanded infrastructure, acquisitions, or a combination of those factors. That said, the key question for long-term shareholders is whether scale growth can now convert into better returns and stronger cash generation rather than simply larger reported revenue.
Risks
This article is for informational purposes only and does not constitute financial advice. Some content is AI-generated. See Disclaimer


