Stock Analysis · Wharf Limited (WARFF)
Overview
Wharf Limited is a Hong Kong-based property company focused on real estate development, investment properties, hotels, and logistics. The group is best known for owning and developing large-scale commercial and residential properties, mainly in Hong Kong and mainland China. For long-term readers, the key point is that this is an asset-heavy real estate business whose results can swing sharply depending on property sales, asset valuations, and conditions in the Hong Kong and China property markets.
Its revenue base is spread across several activities, but property development has historically been the largest driver of reported sales, while investment properties and hotels contribute recurring operating income. Based on recent annual reporting and segment disclosures, the business mix can be summarized approximately as follows:
- Property development: roughly 50% to 65% of revenue in recent years. This includes residential and commercial project sales in Hong Kong and mainland China, and it is the most cyclical part of the business.
- Investment properties: roughly 15% to 30% of revenue. This mainly comes from rental income from malls, offices, and other commercial assets. These assets are usually more stable than development sales.
- Hotels: roughly 10% to 20% of revenue. This includes room revenue, food and beverage, and related hospitality operations.
- Logistics and other operations: generally a smaller share. This includes modern terminals and other supporting businesses, depending on the reporting period.
The broad pattern matters more than exact yearly percentages: Wharf combines recurring rental assets with much more volatile development activity. That gives it a mixed profile—part landlord, part property developer, with earnings often heavily influenced by revaluation movements and the timing of project completions.
Over the last several years, revenue has moved down from the stronger 2021 level, and profit has been much more volatile than sales. Gross profit remained positive, but operating income and net income swung from strong profitability in 2021 to losses in 2022 and 2024, then back toward near break-even in 2025. That reflects how sensitive the company is to a weak property cycle and asset write-downs rather than just day-to-day operating performance.
The financial flow highlights a company that still generates meaningful gross profit from its assets and projects, but whose bottom line has been heavily pressured by the downturn in property markets. The recent picture is one of shrinking revenue, thinner operating performance, and much lower profit conversion than earlier in the cycle.
Key Figures
| Metric | Value | Sector ⓘ |
|---|---|---|
| Date | Oct 17, 2026 | |
| Context | ||
| Sector | Real Estate | |
| Industry | Real Estate - Development | |
| Market Cap ⓘ | $7.55B | |
| Beta ⓘ | 0.27 | |
Value (Cheapness) | ||
| P/E Ratio ⓘ | N/A | 17.38 |
| P/B Ratio ⓘ | 0.01 | 0.85 |
| FCF Yield ⓘ | 119.57% | 7.38% |
| Dividend Yield ⓘ | 16.19% | 4.85% |
| EBIT / EV ⓘ | N/A | 3.78% |
| PEG ⓘ | 1.58 | |
Growth (Business expansion) | ||
| Revenue Growth ⓘ | -5.70% | 5.30% |
| RPS Growth (5Y CAGR) ⓘ | 39.83% | 6.02% |
| EPS Growth (5Y CAGR) ⓘ | -67.04% | -11.37% |
| BVPS Growth (5Y CAGR) ⓘ | 61.31% | 0.45% |
| Margin Growth (5Y Trend) ⓘ | -40.60% | -0.22% |
| FCF Growth (5Y CAGR) ⓘ | 16.91% | 5.40% |
| DPS Growth (5Y CAGR) ⓘ | 67.02% | 5.02% |
Quality (Business durability) | ||
| ROIC (Latest) ⓘ | N/A | 5.69% |
| ROE (Latest) ⓘ | -0.35% | 7.56% |
| ROA (Latest) ⓘ | -0.25% | 2.85% |
| ROIC (5Y Median) ⓘ | -0.78% | 4.22% |
| ROE (5Y Median) ⓘ | 0.04% | 6.03% |
| ROA (5Y Median) ⓘ | 0.03% | 2.44% |
| Net Debt / EBIT (Latest) ⓘ | N/A | 7.59 |
| Net Debt / EBIT (5Y Median) ⓘ | 1.38 | 8.40 |
| Net Debt / EBITDA (Latest) ⓘ | N/A | 5.27 |
| Net Debt / Assets ⓘ | -3.21% | 37.76% |
| EBITDA / Interest ⓘ | N/A | 4.10 |
| Operating Margin (Latest) ⓘ | -67.71% | 35.29% |
| Operating Margin (5Y Median) ⓘ | 3.21% | 37.31% |
| Debt to Equity (Latest) ⓘ | 11.70% | 88.87% |
| Profit Margin (Latest) ⓘ | -4.09% | 19.61% |
| Free Cash Flow (Latest) ⓘ | $9.03B | |
Momentum (Price trend) | ||
| 3Y Return ⓘ | +6.32% | +30.75% |
| 12M Return (excl. last month) ⓘ | -3.01% | +4.36% |
| 6M Return ⓘ | -19.54% | -2.52% |
| Price vs. 200-Day MA ⓘ | +0.30% | -2.34% |
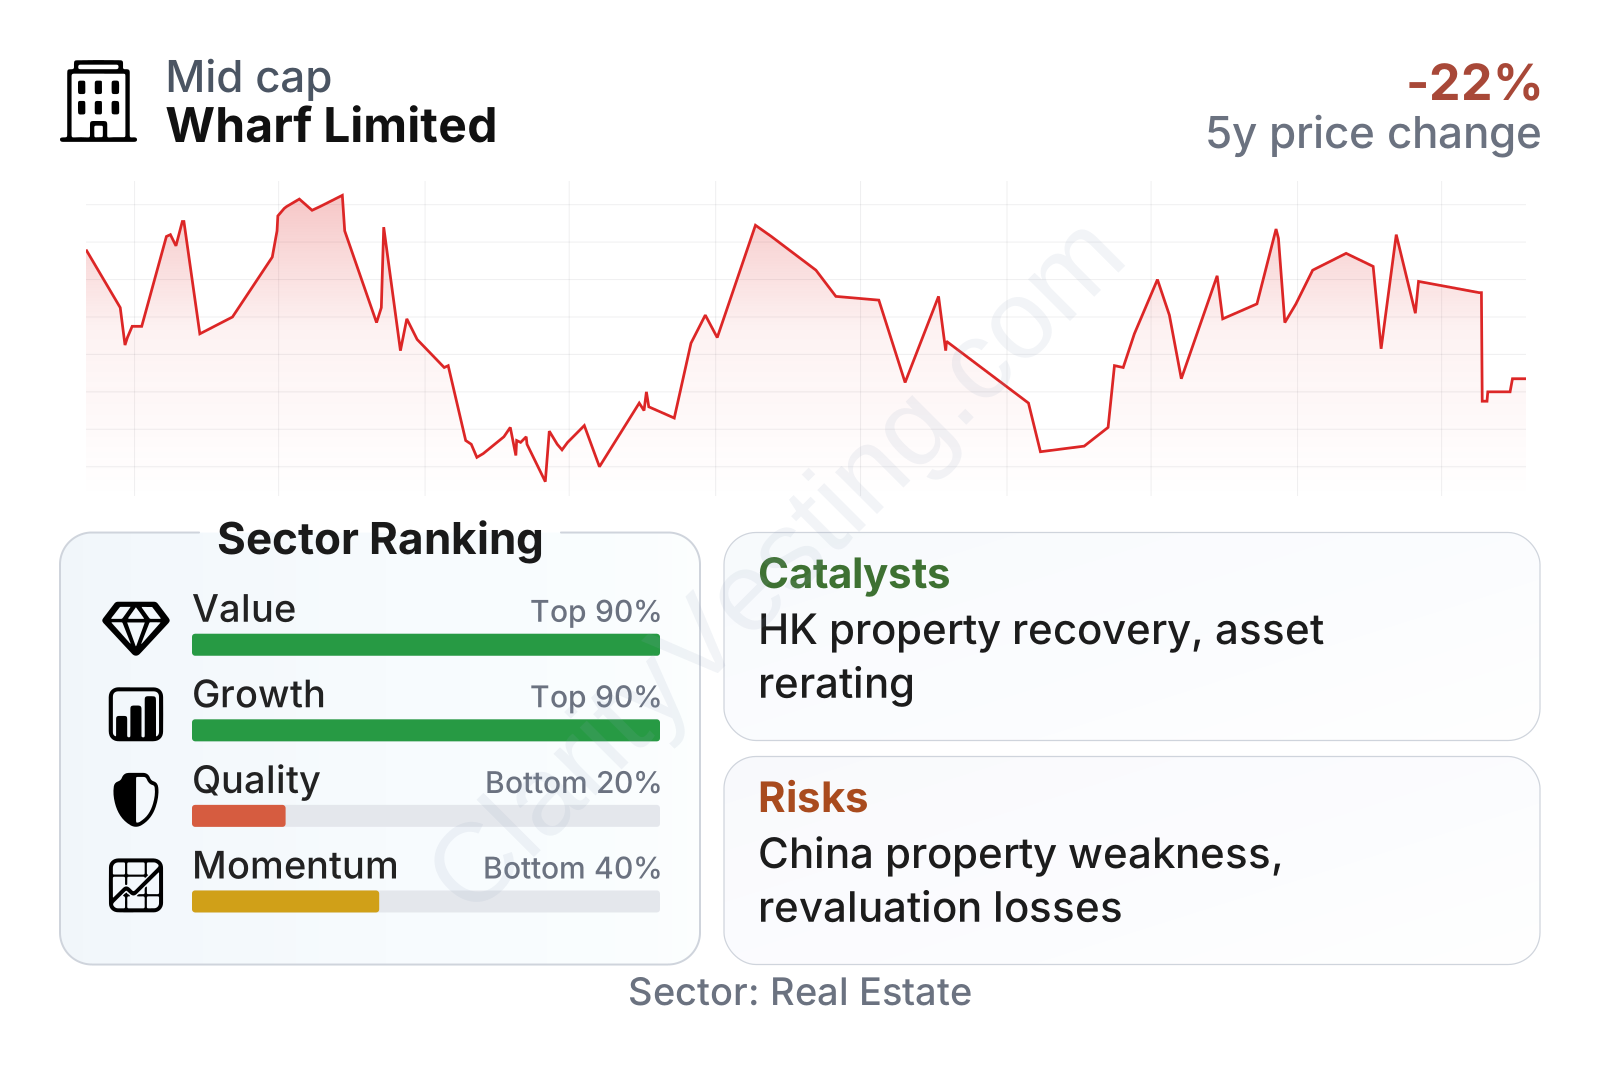
Wharf is a mid-to-large-size real estate company with unusually low share-price volatility, shown by a beta well below 1. On valuation screens, it appears very cheap relative to the sector, especially on price-to-book, and its trailing dividend yield is far above the sector median. Free cash flow also stands out as exceptionally strong on the latest trailing basis.
That said, the quality profile is weak. Recent profitability metrics such as return on equity, return on assets, and profit margin are below sector norms and in some cases negative. The balance sheet looks conservative compared with many real estate peers, with debt-to-equity near 12% and net debt to assets below zero, which suggests substantial asset backing and relatively limited balance-sheet strain. Momentum is also soft, with the stock lagging the sector over the last six months and over the last year excluding the latest month.
Growth
Wharf operates in a sector with long-term structural relevance but weak near-term conditions. Prime commercial property in Hong Kong remains strategically important, and large urban mixed-use projects can retain value over long periods. However, the company is also exposed to mainland China development and to discretionary spending through hotels and retail property, both of which have faced pressure from slower economic growth, softer homebuyer demand, and lower confidence in the property sector.
The company’s strategy still makes industrial sense: combine landmark income-producing assets with selective development profits and preserve financial flexibility. This approach can work well over a full property cycle, especially when weaker competitors face funding pressure. Wharf’s relatively modest leverage compared with the sector gives it more room to wait through a downturn than many highly indebted developers.
Revenue per share has been volatile rather than steadily compounding. After weakening from 2021 through 2024, the latest jump suggests either a major change in reporting, asset-related transactions, or a period of unusually strong revenue recognition. For a long-term reading, that pattern reinforces that Wharf is not a smooth compounding business; it is tied to project timing and property-market swings.
The dividend record has been stable for several years and then shows a sharp increase in the latest period. That kind of step-change is notable because it can indicate a special distribution, a one-off cash event, or a reset tied to realized value rather than a normal recurring growth path. It is more supportive of the company’s asset value and cash-generation capacity than of a predictable annual growth profile.
A meaningful catalyst would be any sustained recovery in Hong Kong retail and office leasing, stabilization in mainland property prices, or improved transaction activity that supports asset values. Lower financing costs could also help, since real estate valuations and buyer affordability are sensitive to interest rates. Another positive factor is that deeply discounted property companies can rerate if the market starts to trust net asset values again.
Recent public disclosures and company reporting point more toward cautious balance-sheet management and resilience than aggressive expansion. That is not exciting, but in a stressed property cycle, capital discipline can itself become an important source of future upside if conditions improve.
Risks
This article is for informational purposes only and does not constitute financial advice. Some content is AI-generated. See Disclaimer


