Stock Analysis · WaFd Inc (WAFDP)
Overview
WaFd Inc is a regional bank. The company operates primarily through Washington Federal Bank and provides traditional banking services to consumers, small businesses, and commercial clients across western and southwestern U.S. markets. In simple terms, it gathers deposits from customers, makes loans, earns interest on those loans and securities, and also collects fees from banking services.
Its business model is straightforward for a bank: low-cost deposits are the funding base, while loans are the main earning assets. Revenue is therefore driven mostly by net interest income, which is the difference between what the bank earns on loans and investments and what it pays on deposits and other funding. Non-interest income exists, but it is much smaller than interest-driven revenue.
The main revenue sources appear to be:
- Net interest income: approximately 85% to 90% of total revenue. This includes interest earned on commercial real estate, multifamily, construction, residential real estate, consumer and commercial loans, minus interest paid on deposits and borrowings.
- Deposit fees and other service charges: approximately 5% to 8%. This generally includes account-related fees, treasury management, card-related fees, and other customer service charges.
- Mortgage banking and loan sale-related income: approximately 1% to 4%. This can include gains on sale, servicing-related items, and mortgage banking activity when market conditions allow.
- Other non-interest income: approximately 2% to 5%. This may include insurance-related items, investment-related fees, and miscellaneous banking income.
That mix matters for long-term analysis because it shows WaFd is still mainly a spread-based bank rather than a broad fee-based financial platform. When interest margins are healthy, that structure can work well. When deposit costs rise quickly, earnings can come under pressure. The multi-year operating picture also shows revenue expanded sharply after the Luther Burbank acquisition, while costs and funding expenses increased as well, which is typical when a bank becomes larger through a deal.
The business has clearly become larger over the last two fiscal years, but the bigger balance sheet has not fully translated into consistently stronger profitability. That is an important theme for the rest of the analysis.
Key Figures
| Metric | Value | Sector ⓘ |
|---|---|---|
| Date | Oct 17, 2026 | |
| Context | ||
| Sector | Financial Services | |
| Industry | Banks - Regional | |
| Market Cap ⓘ | $2.32B | |
| Beta ⓘ | 0.88 | |
Value (Cheapness) | ||
| P/E Ratio ⓘ | 5.44 | 12.26 |
| P/B Ratio ⓘ | 0.37 | 1.23 |
| FCF Yield ⓘ | 9.77% | 10.40% |
| Dividend Yield ⓘ | 7.15% | 3.02% |
| EBIT / EV ⓘ | 8.05% | 8.14% |
| PEG ⓘ | N/A | |
Growth (Business expansion) | ||
| Revenue Growth ⓘ | 5.60% | 9.35% |
| RPS Growth (5Y CAGR) ⓘ | 18.23% | 12.19% |
| EPS Growth (5Y CAGR) ⓘ | N/A | -9.53% |
| BVPS Growth (5Y CAGR) ⓘ | 6.63% | 4.99% |
| Margin Growth (5Y Trend) ⓘ | -15.18% | -3.86% |
| FCF Growth (5Y CAGR) ⓘ | -7.54% | 4.81% |
| DPS Growth (5Y CAGR) ⓘ | 5.57% | 8.79% |
Quality (Business durability) | ||
| ROIC (Latest) ⓘ | 4.75% | 9.49% |
| ROE (Latest) ⓘ | 8.46% | 13.90% |
| ROA (Latest) ⓘ | 0.94% | 1.55% |
| ROIC (5Y Median) ⓘ | 4.45% | 7.86% |
| ROE (5Y Median) ⓘ | 8.39% | 12.17% |
| ROA (5Y Median) ⓘ | 0.96% | 1.30% |
| Net Debt / EBIT (Latest) ⓘ | 8.04 | 0.96 |
| Net Debt / EBIT (5Y Median) ⓘ | 4.00 | 0.73 |
| Net Debt / EBITDA (Latest) ⓘ | 7.76 | 0.92 |
| Operating Margin (Latest) ⓘ | 23.63% | 22.30% |
| Operating Margin (5Y Median) ⓘ | 35.72% | 24.63% |
| Debt to Equity (Latest) ⓘ | 109.70% | 58.56% |
| Profit Margin (Latest) ⓘ | 33.70% | 26.57% |
| Free Cash Flow (Latest) ⓘ | $226.97M | |
Momentum (Price trend) | ||
| 3Y Return ⓘ | +44.20% | +88.33% |
| 12M Return (excl. last month) ⓘ | +4.16% | +19.38% |
| 6M Return ⓘ | -5.70% | +4.75% |
| Price vs. 200-Day MA ⓘ | -4.51% | +3.50% |
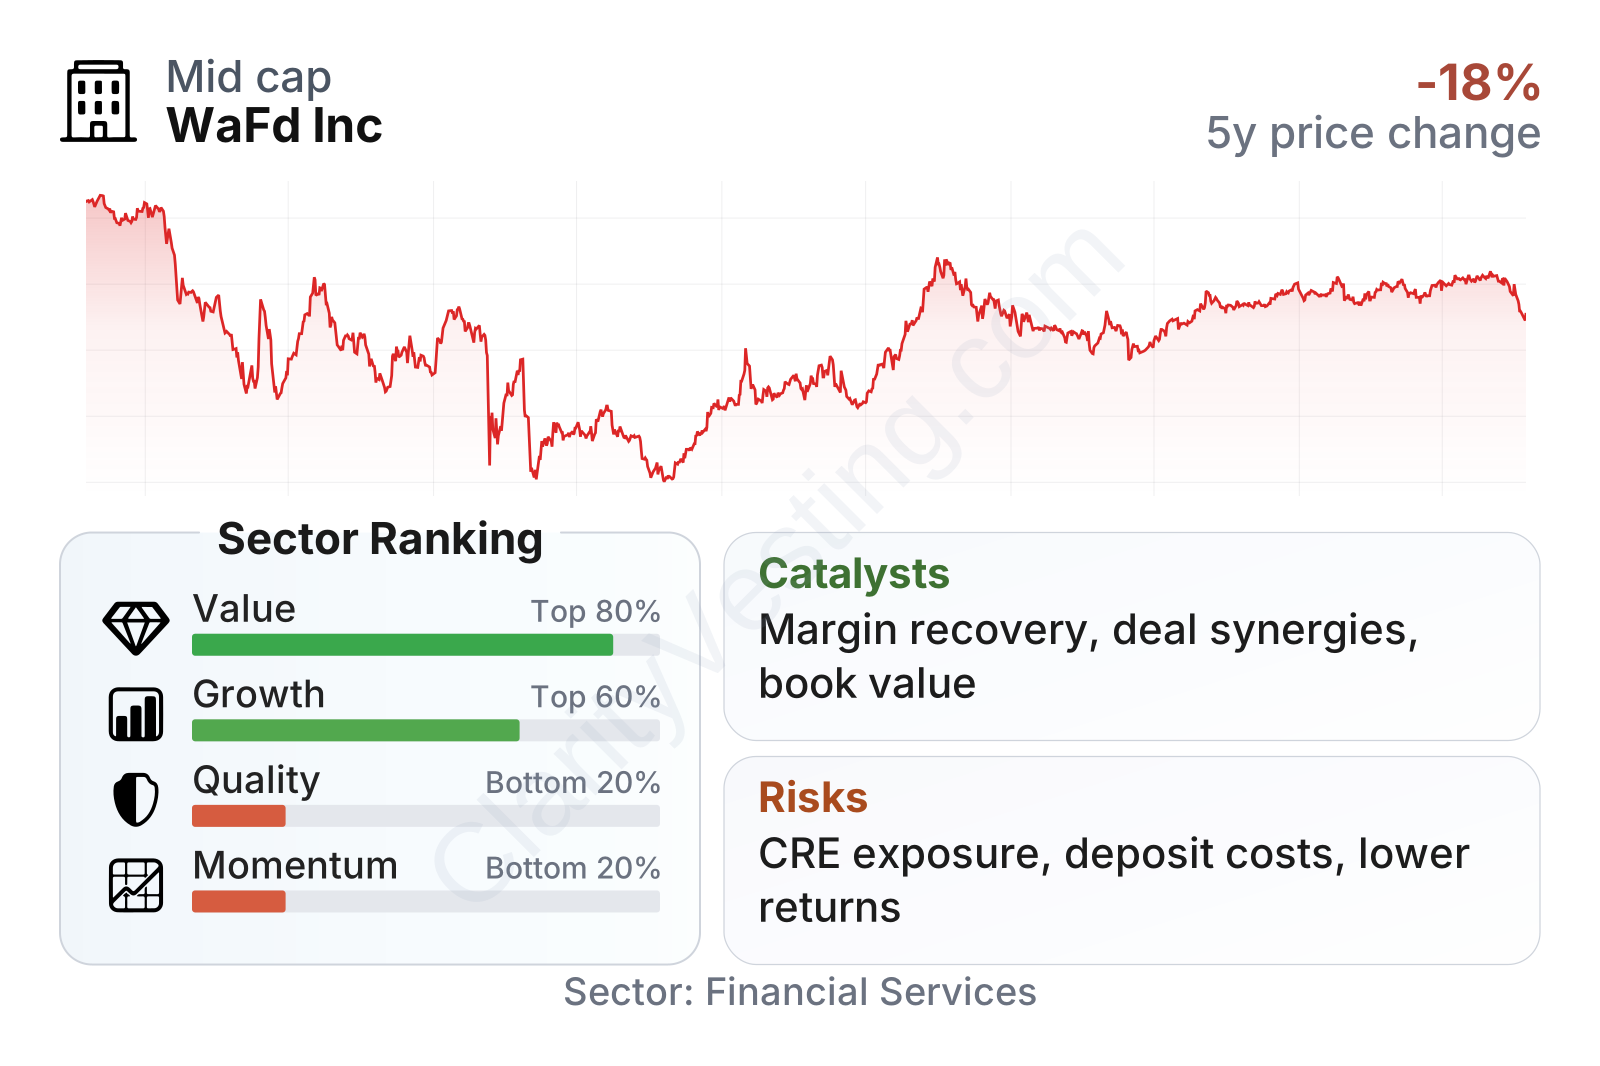
WaFd is a mid-sized regional bank with a relatively low share-price volatility profile, reflected by a beta below 1. The stock has recovered from its 2023 low, but the longer share-price trend still trails much of the regional banking group. That weaker momentum contrasts with a valuation profile that screens as inexpensive: both earnings and book-value multiples sit far below sector norms, while the dividend yield is well above the median.
The table also shows an uneven fundamental picture. On growth, WaFd looks respectable rather than exceptional. Revenue growth has been positive, five-year revenue per share growth is strong, and book value per share has compounded ahead of the sector median. However, profitability quality is weaker. Return on equity and return on assets are below typical regional bank levels, and leverage-related measures look heavier than the sector median. In other words, the market is not assigning a low valuation by accident; it is balancing decent growth and income characteristics against lower operating quality and slower stock-market confidence.
Growth
Regional banking is not a high-growth sector in the way software or semiconductors can be, but it remains an essential part of the economy. Growth usually comes from loan expansion, deposit gathering, branch density in attractive local markets, and acquisitions. WaFd’s footprint gives it exposure to growing states such as Arizona, Idaho, Nevada, Texas, Utah, and Washington, which can support long-term demand for mortgages, small-business lending, and commercial real estate finance.
The company’s strategy has generally been to stay focused on relationship banking while broadening its scale through measured expansion. The Luther Burbank acquisition added more commercial and multifamily exposure and expanded WaFd’s reach, especially in California. That can help revenue diversification and deepen customer relationships, although it also increases integration demands and credit complexity.
One encouraging point is that book value per share has grown at a solid pace over five years, despite a recent pullback after the post-acquisition step-up. For banks, book value is an important anchor because it reflects the capital base supporting future lending and earnings power.
Another useful growth angle is balance-sheet repricing. If deposit costs stabilize and loan yields remain firm, earnings can improve even without rapid asset growth. This is one of the more realistic catalysts for a regional bank today. In addition, if the company continues to extract cost efficiencies from its larger platform, that could support profitability more than simple loan volume growth alone.
Recent company updates have also emphasized capital strength, liquidity management, and disciplined underwriting rather than aggressive expansion. That is not the profile of a bank trying to chase short-term growth, but it can fit a longer-term compounding approach if management converts a larger franchise into steadier returns over time.
Risks
This article is for informational purposes only and does not constitute financial advice. Some content is AI-generated. See Disclaimer


