Stock Analysis · V2X Inc (VVX)
Overview
V2X Inc is a government services contractor focused mainly on defense, national security, and mission support. It provides logistics, maintenance, training, engineering, technology, and operational support for U.S. government customers and allied nations. In simple terms, the company helps military and government clients keep aircraft, vehicles, bases, communications systems, and other critical operations running.
The business became much larger after the 2022 combination of Vectrus and Vertex’s government services business. That transaction reshaped V2X into a broader aerospace and defense support platform with a stronger presence across military readiness, overseas operations, and technical services.
Revenue is heavily concentrated in government contracting, especially the U.S. Department of Defense. Based on company disclosures, the mix is best understood through customer and contract concentration rather than consumer-style product lines.
- U.S. federal government, primarily Department of Defense: the large majority of revenue, roughly 80% to 90%. This includes base operations support, logistics, aircraft maintenance, supply chain support, and readiness services.
- Other U.S. government agencies: roughly 5% to 15%, depending on contract activity. This can include support work tied to security, defense-related technology, and mission operations.
- International and allied government customers: generally a small but meaningful share, often tied to foreign military sales, global logistics, and support programs.
Another useful way to look at V2X is by capability. The company emphasizes mission support, enterprise modernization, and readiness solutions. These cover activities such as sustainment, training, cyber and digital work, and operational support in difficult environments. The revenue base is recurring by nature because many contracts relate to long-duration programs and essential services rather than one-time equipment sales.
The financial flow over the past few years shows a business that has scaled up significantly since the merger, with revenue rising from below $2 billion in 2021 to around $4.5 billion in 2025. At the same time, operating income has improved and interest expense has begun to ease, which matters because debt has been one of the key constraints on profitability.
Key Figures
| Metric | Value | Sector ⓘ |
|---|---|---|
| Date | Oct 17, 2026 | |
| Context | ||
| Sector | Industrials | |
| Industry | Aerospace & Defense | |
| Market Cap ⓘ | $2.11B | |
| Beta ⓘ | 0.19 | |
Value (Cheapness) | ||
| P/E Ratio ⓘ | 23.20 | 22.10 |
| P/B Ratio ⓘ | 1.89 | 1.97 |
| FCF Yield ⓘ | 6.18% | 6.38% |
| Dividend Yield ⓘ | N/A | 1.94% |
| EBIT / EV ⓘ | 6.18% | 4.79% |
| PEG ⓘ | N/A | |
Growth (Business expansion) | ||
| Revenue Growth ⓘ | 16.50% | 9.30% |
| RPS Growth (5Y CAGR) ⓘ | -1.69% | 7.81% |
| EPS Growth (5Y CAGR) ⓘ | 3.86% | -13.06% |
| BVPS Growth (5Y CAGR) ⓘ | 3.61% | 6.14% |
| Margin Growth (5Y Trend) ⓘ | 0.67% | 0.88% |
| FCF Growth (5Y CAGR) ⓘ | 34.76% | 11.01% |
| DPS Growth (5Y CAGR) ⓘ | -48.00% | 9.48% |
Quality (Business durability) | ||
| ROIC (Latest) ⓘ | 7.04% | 10.84% |
| ROA (Latest) ⓘ | 2.88% | 5.41% |
| ROIC (5Y Median) ⓘ | 4.88% | 9.38% |
| ROA (5Y Median) ⓘ | 1.10% | 4.95% |
| Net Debt / EBIT (Latest) ⓘ | 4.30 | 2.08 |
| Net Debt / EBIT (5Y Median) ⓘ | 5.97 | 2.27 |
| Net Debt / EBITDA (Latest) ⓘ | 2.72 | 1.39 |
| Net Debt / Assets ⓘ | 26.57% | 19.28% |
| EBITDA / Interest ⓘ | 3.88 | 9.58 |
| Operating Margin (Latest) ⓘ | 4.04% | 10.50% |
| Operating Margin (5Y Median) ⓘ | 3.42% | 10.29% |
| Debt to Equity (Latest) ⓘ | 93.80% | 65.48% |
| Profit Margin (Latest) ⓘ | 1.88% | 6.67% |
| Free Cash Flow (Latest) ⓘ | $130.45M | |
Momentum (Price trend) | ||
| 3Y Return ⓘ | +28.99% | +61.68% |
| 12M Return (excl. last month) ⓘ | +34.91% | +12.58% |
| 6M Return ⓘ | -1.30% | 0.00% |
| Price vs. 200-Day MA ⓘ | -6.70% | +0.02% |
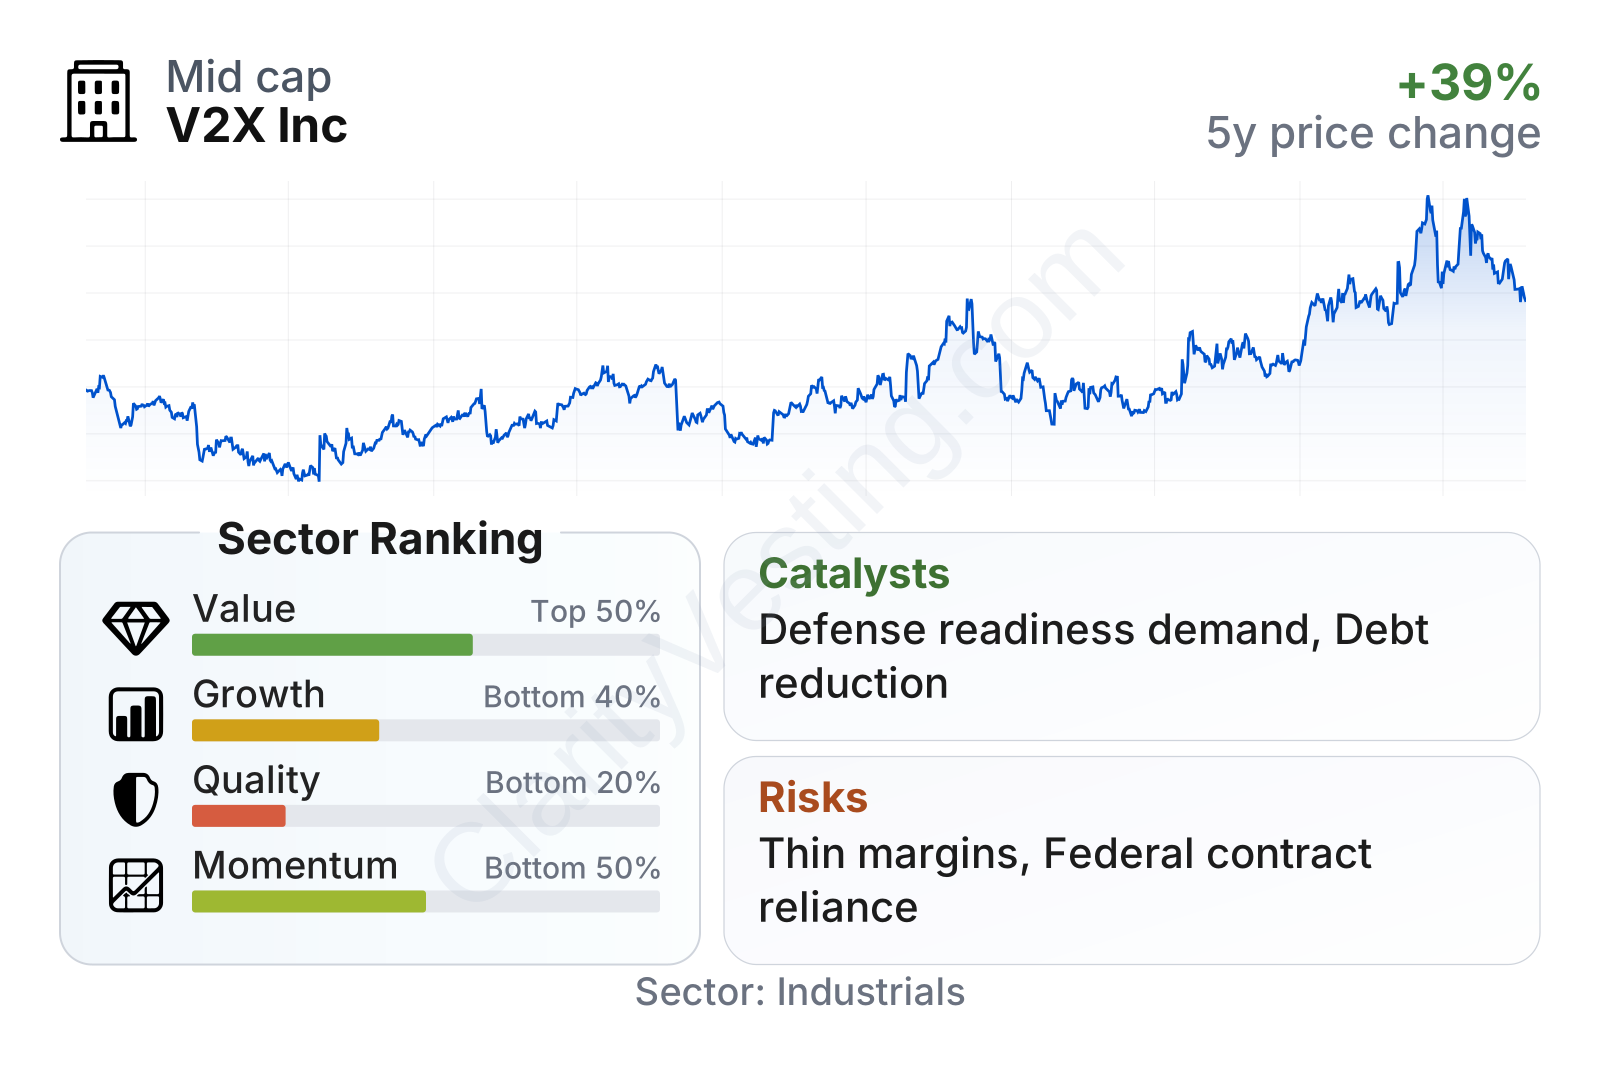
V2X is a mid-sized aerospace and defense contractor with relatively low share-price volatility, as shown by its low beta. The factor profile is mixed. Value metrics sit around the sector middle rather than clearly cheap territory, momentum has been solid over the last year, but quality measures remain weak compared with many peers because margins are thin and leverage is still elevated. Growth indicators also need context: recent revenue expansion looks healthy, yet the longer multi-year record is distorted by the merger and has not translated into high profitability.
Growth
V2X operates in a sector with durable long-term demand. Defense spending tends to be driven by military readiness, global tensions, fleet maintenance, modernization of legacy systems, and the need to support operations in multiple regions. Those themes generally favor contractors that can handle logistics, sustainment, and technical support at scale. This is not the fastest-growing part of aerospace and defense, but it is often steadier than areas that depend on large equipment orders.
The company’s strategy is logical for that environment. Rather than trying to compete head-to-head with major prime contractors building headline weapons platforms, V2X focuses on the less glamorous but essential work that keeps missions functioning every day. That can create recurring demand because aircraft, vehicles, communications systems, and overseas facilities all require ongoing support.
Recent sales trends have improved again after a slower period in 2025. Revenue growth moved back into the mid-teens in the latest period, well above the sector median. That suggests V2X is still winning work and expanding on existing programs. The more important question for long-term analysis is whether this growth remains contract-driven and disciplined, rather than relying mainly on acquisitions.
One important catalyst is backlog and contract awards. V2X regularly highlights a large pipeline of government opportunities tied to readiness, training, global logistics, and technology-enabled support. In 2026, the company also announced progress on major contract activity and continued positioning around defense modernization and contested logistics. These are areas where governments are spending to improve resilience and operational availability.
Another encouraging point is cash generation. Even though accounting profits remain modest, free cash flow has improved sharply compared with the period right after the merger, showing that integration benefits and working-capital management are helping the business convert more of its scale into usable cash.
Free cash flow pulled back from its 2025 peak, but it remains materially stronger than a few years ago. For a business with leverage, that matters a lot because excess cash can support debt reduction, interest savings, and eventually stronger earnings quality.
Risks
This article is for informational purposes only and does not constitute financial advice. Some content is AI-generated. See Disclaimer


