Stock Analysis · Viatris Inc (VTRS)
Overview
Viatris is a global pharmaceutical company focused on generic medicines, branded drugs, complex injectables, biosimilars, and consumer health products. The company was formed through the combination of Mylan and Upjohn, Pfizer’s off-patent and legacy brands business. Its role in healthcare is relatively easy to understand: it sells a very broad portfolio of medicines that are already well known to doctors and health systems, while also trying to add newer complex products that can support pricing and margins over time.
Its business is spread across many countries, which reduces dependence on a single market, but it also means the company operates in a part of healthcare where pricing pressure is constant. Viatris is not primarily a high-risk drug discovery company. Instead, it is built around scale, manufacturing, distribution, regulatory know-how, and life-cycle management of established products.
Based on recent company reporting, revenue is mainly organized by geography rather than by strict product line. Approximate revenue mix is:
- Developed Markets – about 38% to 40%: mainly North America and other mature healthcare systems, including a large mix of generic medicines, established brands, and certain specialty products.
- Greater China – about 15% to 20%: branded off-patent medicines and hospital-focused products, with performance influenced by local procurement policies and pricing reforms.
- JANZ (Japan, Australia, and New Zealand) – about 10% to 15%: established brands and generic products sold into mature regulated markets.
- Emerging Markets – about 25% to 30%: a wide portfolio of branded generics, prescription medicines, and consumer health products across Latin America, Asia, the Middle East, and parts of Europe and Africa.
At the product level, the company’s largest economic engine remains generic and established branded medicines, while complex injectables, biosimilars, and novel partnerships are intended to become a larger share over time. This mix matters because mature products provide scale and cash flow, while the more specialized portfolio is supposed to offset the gradual decline seen in older assets.
Revenue has trended lower over the last several years, while profitability has been uneven. The broad financial flow also shows that selling, administrative, and financing costs remain meaningful, which helps explain why strong gross profit does not always translate into solid net earnings. Even so, the company still generates substantial cash from operations relative to its size.
Key Figures
| Metric | Value | Sector ⓘ |
|---|---|---|
| Date | Oct 17, 2026 | |
| Context | ||
| Sector | Healthcare | |
| Industry | Drug Manufacturers - Specialty & Generic | |
| Market Cap ⓘ | $20.03B | |
| Beta ⓘ | 0.86 | |
Value (Cheapness) | ||
| P/E Ratio ⓘ | N/A | 24.79 |
| P/B Ratio ⓘ | 1.49 | 3.08 |
| FCF Yield ⓘ | 9.35% | 3.15% |
| Dividend Yield ⓘ | 2.78% | 1.94% |
| EBIT / EV ⓘ | -0.27% | 0.57% |
| PEG ⓘ | 1.05 | |
Growth (Business expansion) | ||
| Revenue Growth ⓘ | 4.90% | 7.45% |
| RPS Growth (5Y CAGR) ⓘ | -4.68% | 8.61% |
| EPS Growth (5Y CAGR) ⓘ | -22.64% | -17.81% |
| BVPS Growth (5Y CAGR) ⓘ | -7.21% | 3.72% |
| Margin Growth (5Y Trend) ⓘ | N/A | -0.62% |
| FCF Growth (5Y CAGR) ⓘ | -6.25% | 1.04% |
| DPS Growth (5Y CAGR) ⓘ | 9.78% | 6.77% |
Quality (Business durability) | ||
| ROIC (Latest) ⓘ | -0.24% | 3.24% |
| ROA (Latest) ⓘ | -1.13% | 3.01% |
| ROIC (5Y Median) ⓘ | -0.06% | 4.60% |
| ROA (5Y Median) ⓘ | -1.42% | 1.89% |
| Net Debt / EBIT (Latest) ⓘ | N/A | 1.34 |
| Net Debt / EBIT (5Y Median) ⓘ | N/A | 1.84 |
| Net Debt / EBITDA (Latest) ⓘ | 4.69 | 1.00 |
| Net Debt / Assets ⓘ | 36.35% | 5.45% |
| EBITDA / Interest ⓘ | 5.66 | 9.64 |
| Operating Margin (Latest) ⓘ | -0.59% | 9.27% |
| Operating Margin (5Y Median) ⓘ | -0.16% | 7.38% |
| Debt to Equity (Latest) ⓘ | 95.55% | 28.58% |
| Profit Margin (Latest) ⓘ | -2.79% | 3.59% |
| Free Cash Flow (Latest) ⓘ | $1.87B | |
Momentum (Price trend) | ||
| 3Y Return ⓘ | +118.23% | +42.80% |
| 12M Return (excl. last month) ⓘ | +79.59% | +18.50% |
| 6M Return ⓘ | +33.42% | +7.57% |
| Price vs. 200-Day MA ⓘ | +18.32% | +5.12% |
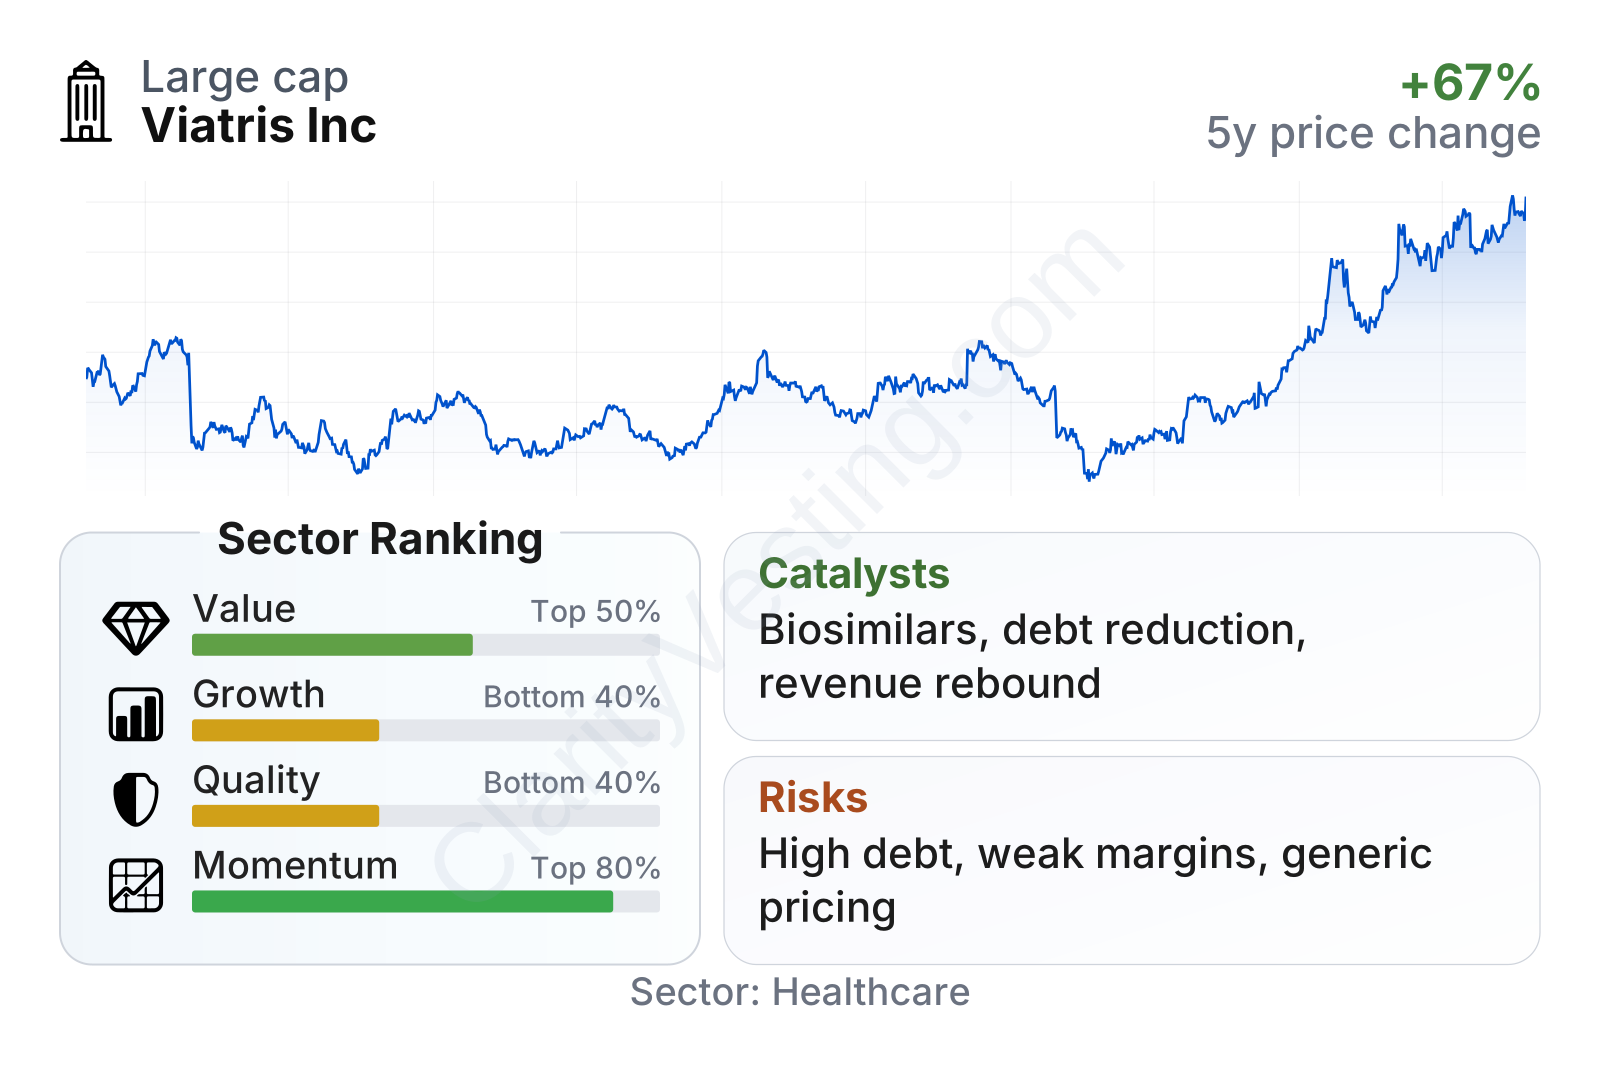
Viatris is a large healthcare company with a stock that has shown strong momentum recently after a long period of weak sentiment. The factor profile is unusual: value looks relatively attractive, helped by a free cash flow yield around 9% and a price-to-book ratio below the sector median, while growth and quality remain weaker than much of the healthcare group. Profitability metrics are still below sector norms, but the share price has recovered sharply over the last year and over the last three years, indicating that the market has started to price in some stabilization.
The company’s lower beta, around 0.88, suggests that the stock has historically moved somewhat less than the broader market. That said, the business itself is not low-risk in a fundamental sense because leverage, margin pressure, and product erosion remain important issues beneath the surface.
Growth
Viatris operates in a healthcare segment that should remain relevant for a long time. Demand for lower-cost medicines generally benefits from aging populations, rising healthcare needs, and payer pressure to reduce treatment costs. That creates a durable market backdrop for generics, branded generics, and biosimilars. However, this is not automatically a high-growth corner of healthcare. Volume can expand while pricing declines, so growth depends heavily on product mix and execution.
The company’s strategy broadly makes sense for that reality. Management has been trying to shift the portfolio toward higher-value categories such as complex injectables, ophthalmology, biosimilars, and selected innovative partnerships, while using cash flow to reduce debt and support shareholder returns. The strategic logic is clear: legacy products alone are unlikely to deliver much expansion, so future improvement depends on replacing declining mature revenue with more durable and less commoditized assets.
Recent revenue trends suggest that the worst of the decline may be easing. After a long stretch of year-over-year contraction, growth turned positive in late 2025 and remained positive in early 2026, landing in the mid-single-digit range more recently. That does not yet prove a durable growth cycle, but it does support the idea that the portfolio is becoming more stable after several years of resets, divestitures, and pricing headwinds.
Free cash flow remains one of the most important supportive elements in the Viatris case. Even though the trailing figure has gradually moved down from earlier levels, it still sits in the neighborhood of $1.7 billion, which is substantial. That cash generation gives the company flexibility to manage debt, fund launches, and maintain its dividend even while accounting earnings remain volatile.
A meaningful catalyst is the continued expansion of Viatris’s biosimilar and complex product pipeline, including commercialization partnerships that can improve the mix of revenue. Another potential catalyst is balance sheet repair: if debt continues to come down and operating performance becomes steadier, the market may place more weight on cash flow than on temporary earnings noise. Recent company updates have also highlighted ongoing portfolio reshaping and product launches, which matter because small improvements across a broad global base can have a visible effect on results.
Risks
This article is for informational purposes only and does not constitute financial advice. Some content is AI-generated. See Disclaimer


