Stock Analysis · Vistra Corp (VST)
Overview
Vistra Corp is a large U.S. power company that produces electricity, sells it in wholesale markets, and supplies homes and businesses through retail electricity plans. Unlike a traditional regulated utility that mainly earns set returns from a local service territory, Vistra has a large competitive power business. That means its results are influenced by power prices, fuel costs, hedging decisions, weather, and the balance between supply and demand in the regions where it operates.
The company’s asset base includes natural gas, nuclear, coal, solar, and battery storage facilities, with an especially important presence in Texas through the ERCOT market. Retail brands sell electricity and related products directly to end customers, while the generation fleet provides the physical power and capacity behind the business. This combination gives Vistra exposure to both consumer demand and wholesale market opportunities.
Based on recent company reporting, Vistra’s revenue is mainly generated from two broad areas:
- Generation: approximately 70% to 80% of revenue in recent periods. This includes wholesale electricity sales, capacity-related revenues, hedging and optimization activity, and output from the company’s generation fleet across competitive markets.
- Retail: approximately 20% to 30% of revenue in recent periods. This includes electricity plans for residential, commercial, and industrial customers, along with customer-related products and services.
These percentages can move meaningfully from year to year because power markets are volatile and accounting treatment for hedging can affect reported revenue. The broader picture is that wholesale generation remains the larger economic engine, while retail adds customer reach and some demand stability.
Over the last several years, the business has moved from losses to much stronger profitability, helped by improved operating income and higher gross profit in 2023 and 2024. Revenue has not followed a straight line, which is normal for merchant power businesses, but the company has shown that stronger margins can matter more than simple top-line growth.
A notable pattern is the improvement from negative operating income earlier in the period to clearly positive earnings later on, although 2025 also showed how quickly profits can compress when market conditions become less favorable. That variability is central to understanding Vistra.
Key Figures
| Metric | Value | Sector ⓘ |
|---|---|---|
| Date | Oct 04, 2026 | |
| Context | ||
| Sector | Utilities | |
| Industry | Utilities - Independent Power Producers | |
| Market Cap ⓘ | $47.00B | |
| Beta ⓘ | 1.41 | |
Value (Cheapness) | ||
| P/E Ratio ⓘ | 23.57 | 16.83 |
| P/B Ratio ⓘ | 8.70 | 1.48 |
| FCF Yield ⓘ | 2.93% | 0.63% |
| Dividend Yield ⓘ | 0.65% | 3.91% |
| EBIT / EV ⓘ | 5.52% | 5.01% |
| PEG ⓘ | 0.34 | |
Growth (Business expansion) | ||
| Revenue Growth ⓘ | -5.50% | 6.00% |
| RPS Growth (5Y CAGR) ⓘ | 15.93% | 4.14% |
| EPS Growth (5Y CAGR) ⓘ | N/A | -11.39% |
| BVPS Growth (5Y CAGR) ⓘ | 3.55% | 4.29% |
| Margin Growth (5Y Trend) ⓘ | 21.99% | 3.55% |
| FCF Growth (5Y CAGR) ⓘ | N/A | -9.10% |
| DPS Growth (5Y CAGR) ⓘ | 24.94% | 4.51% |
Quality (Business durability) | ||
| ROIC (Latest) ⓘ | 13.41% | 6.53% |
| ROA (Latest) ⓘ | 5.50% | 3.19% |
| ROIC (5Y Median) ⓘ | 9.04% | 6.12% |
| ROA (5Y Median) ⓘ | 2.38% | 2.76% |
| Net Debt / EBIT (Latest) ⓘ | 5.17 | 7.15 |
| Net Debt / EBIT (5Y Median) ⓘ | 4.07 | 7.24 |
| Net Debt / EBITDA (Latest) ⓘ | 3.00 | 4.40 |
| Net Debt / Assets ⓘ | 45.68% | 39.16% |
| EBITDA / Interest ⓘ | 5.66 | 4.41 |
| Operating Margin (Latest) ⓘ | 23.56% | 20.93% |
| Operating Margin (5Y Median) ⓘ | 13.56% | 20.18% |
| Debt to Equity (Latest) ⓘ | 362.91% | 140.88% |
| Profit Margin (Latest) ⓘ | 11.55% | 11.32% |
| Free Cash Flow (Latest) ⓘ | $1.38B | |
Momentum (Price trend) | ||
| 3Y Return ⓘ | +348.88% | +49.22% |
| 12M Return (excl. last month) ⓘ | -22.39% | +11.22% |
| 6M Return ⓘ | -7.10% | -4.08% |
| Price vs. 200-Day MA ⓘ | -9.35% | -1.77% |
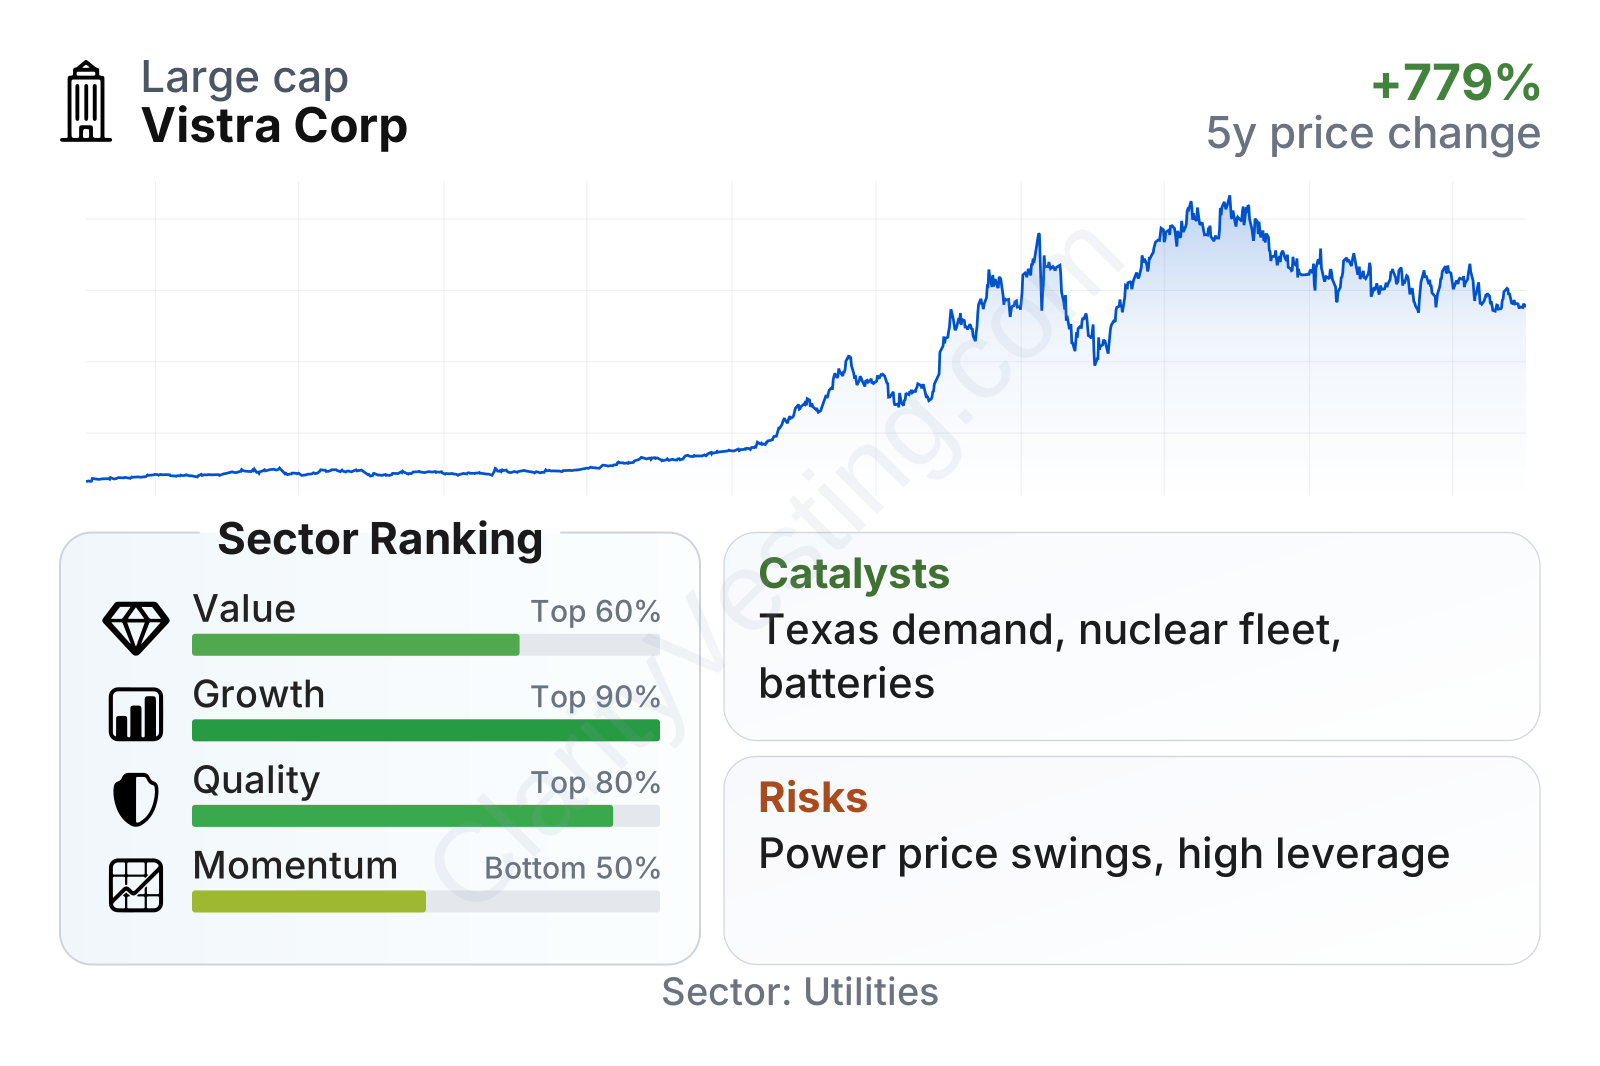
Vistra stands out for strong growth and solid operating quality relative to much of the utility universe, but it does not look conventionally cheap. Profitability measures such as return on invested capital and operating margin are above sector medians, while leverage remains high on a debt-to-equity basis. Share-price performance over several years has been exceptionally strong, yet shorter-term momentum has cooled, showing that the market has already priced in a meaningful part of the improvement narrative.
At a high level, Vistra is a large-cap utility-sector company with above-average share-price volatility. Its free cash flow yield is stronger than the sector median, but the dividend yield is much lower than many utility peers because the market has emphasized growth and power-market exposure rather than income characteristics.
Growth
Vistra operates in a part of the power industry that is benefiting from several long-term demand drivers. U.S. electricity consumption is being supported by data centers, manufacturing expansion, electrification, and rising needs for grid flexibility. That is especially relevant in Texas, where population growth, industrial activity, and digital infrastructure have kept electricity demand strong. For a company with a large generation position in competitive markets, this can create a favorable setup if supply stays relatively tight.
The strategy also fits where the power system is heading. Vistra has been investing in dispatchable generation, nuclear exposure, and battery storage. Batteries are increasingly valuable because they help balance the grid when renewable output changes throughout the day. At the same time, reliable thermal and nuclear generation becomes more important when demand is rising and grids need stability. This mix gives the company several ways to participate in future market needs rather than relying on only one technology.
Revenue per share has increased substantially over the last five years even though annual revenue can swing from one period to another. That suggests the company has expanded its earnings power over time rather than simply benefiting from a one-off volume spike. The latest year showed some pullback from the 2024 peak, but the multi-year trend remains strong compared with most sector peers.
Cash generation has also improved versus earlier years, although it is not perfectly smooth. Free cash flow moved from a negative reading in 2023 to a very strong level in 2024 and remained positive afterward, even with a lower recent run rate. For a capital-intensive power company, that matters because cash supports debt service, shareholder returns, and future investment in storage and generation assets.
A major recent catalyst is Vistra’s enlarged role in nuclear generation through its combination with Energy Harbor, which added zero-carbon baseload generation and broadened the company’s exposure to power demand that values reliability. Another important industry catalyst is the surge in data-center electricity demand, particularly in markets such as Texas. Public company communications in 2026 have continued to emphasize demand growth, generation availability, and the value of dispatchable and nuclear assets in tighter power markets.
Risks
This article is for informational purposes only and does not constitute financial advice. Some content is AI-generated. See Disclaimer


