Stock Analysis · Verisk Analytics Inc (VRSK)
Overview
Verisk Analytics is a data analytics and decision-support company best known for serving the insurance industry. In simple terms, it helps insurers, reinsurers, brokers, corporations, and public-sector clients price risk, detect fraud, model catastrophes, and make underwriting decisions. Its products are deeply embedded in customer workflows, which matters because insurance companies rely on stable, comparable, and highly specialized information over very long periods.
Since the sale of its energy and specialized markets businesses in recent years, Verisk has become much more focused. Today, the company is centered mainly on insurance-related analytics and software, with an additional smaller business in healthcare fraud and payment integrity. That narrower structure makes the business easier to understand: it is largely a recurring-revenue analytics provider to an industry where data quality, regulatory demands, and risk modeling are essential.
Based on the company’s recent annual reporting structure, Verisk’s revenue mix is approximately:
- Insurance segment: about 85% to 90% of revenue. This includes underwriting data, claims analytics, property estimating tools, catastrophe and extreme-event modeling, marketing solutions, and workflow software used across personal and commercial insurance.
- Healthcare segment: about 10% to 15% of revenue. This business focuses on payment accuracy, fraud detection, and related analytics for healthcare claims and reimbursement processes.
The business model is attractive because much of Verisk’s income comes from subscriptions, long-term customer relationships, transaction-based usage tied to industry workflows, and products that become difficult to replace once integrated into daily operations. Over the last several years, revenue has trended upward while operating profitability has remained unusually strong for a company classified in consulting and analytics.
The revenue and profit flow over time shows a business with expanding sales, consistently high gross profitability, and very strong operating income conversion. There was some earnings volatility around 2023, but the broader pattern remains one of a high-margin information provider rather than a labor-intensive traditional consultancy.
Key Figures
| Metric | Value | Sector ⓘ |
|---|---|---|
| Date | Oct 24, 2026 | |
| Context | ||
| Sector | Industrials | |
| Industry | Consulting Services | |
| Market Cap ⓘ | $24.84B | |
| Beta ⓘ | 0.69 | |
Value (Cheapness) | ||
| P/E Ratio ⓘ | 29.32 | 22.29 |
| P/B Ratio ⓘ | N/A | 1.98 |
| FCF Yield ⓘ | 4.98% | 6.26% |
| Dividend Yield ⓘ | 1.00% | 1.92% |
| EBIT / EV ⓘ | 5.12% | 4.83% |
| PEG ⓘ | 1.45 | |
Growth (Business expansion) | ||
| Revenue Growth ⓘ | 4.40% | 9.30% |
| RPS Growth (5Y CAGR) ⓘ | 10.02% | 7.76% |
| EPS Growth (5Y CAGR) ⓘ | -10.50% | -13.17% |
| BVPS Growth (5Y CAGR) ⓘ | -39.99% | 6.13% |
| Margin Growth (5Y Trend) ⓘ | 7.74% | 0.74% |
| FCF Growth (5Y CAGR) ⓘ | 7.66% | 10.79% |
| DPS Growth (5Y CAGR) ⓘ | 11.88% | 9.41% |
Quality (Business durability) | ||
| ROIC (Latest) ⓘ | 29.10% | 10.75% |
| ROA (Latest) ⓘ | 16.49% | 5.41% |
| ROIC (5Y Median) ⓘ | 19.95% | 9.37% |
| ROA (5Y Median) ⓘ | 12.92% | 4.95% |
| Net Debt / EBIT (Latest) ⓘ | 3.00 | 2.04 |
| Net Debt / EBIT (5Y Median) ⓘ | 2.44 | 2.27 |
| Net Debt / EBITDA (Latest) ⓘ | 2.42 | 1.39 |
| Net Debt / Assets ⓘ | 90.43% | 19.27% |
| EBITDA / Interest ⓘ | 8.61 | 9.58 |
| Operating Margin (Latest) ⓘ | 43.18% | 10.49% |
| Operating Margin (5Y Median) ⓘ | 44.83% | 10.30% |
| Debt to Equity (Latest) ⓘ | -388.32% | 64.82% |
| Profit Margin (Latest) ⓘ | 28.24% | 6.67% |
| Free Cash Flow (Latest) ⓘ | $1.24B | |
Momentum (Price trend) | ||
| 3Y Return ⓘ | -16.13% | +67.77% |
| 12M Return (excl. last month) ⓘ | -28.64% | +12.05% |
| 6M Return ⓘ | +6.20% | 0.00% |
| Price vs. 200-Day MA ⓘ | +3.11% | +0.67% |
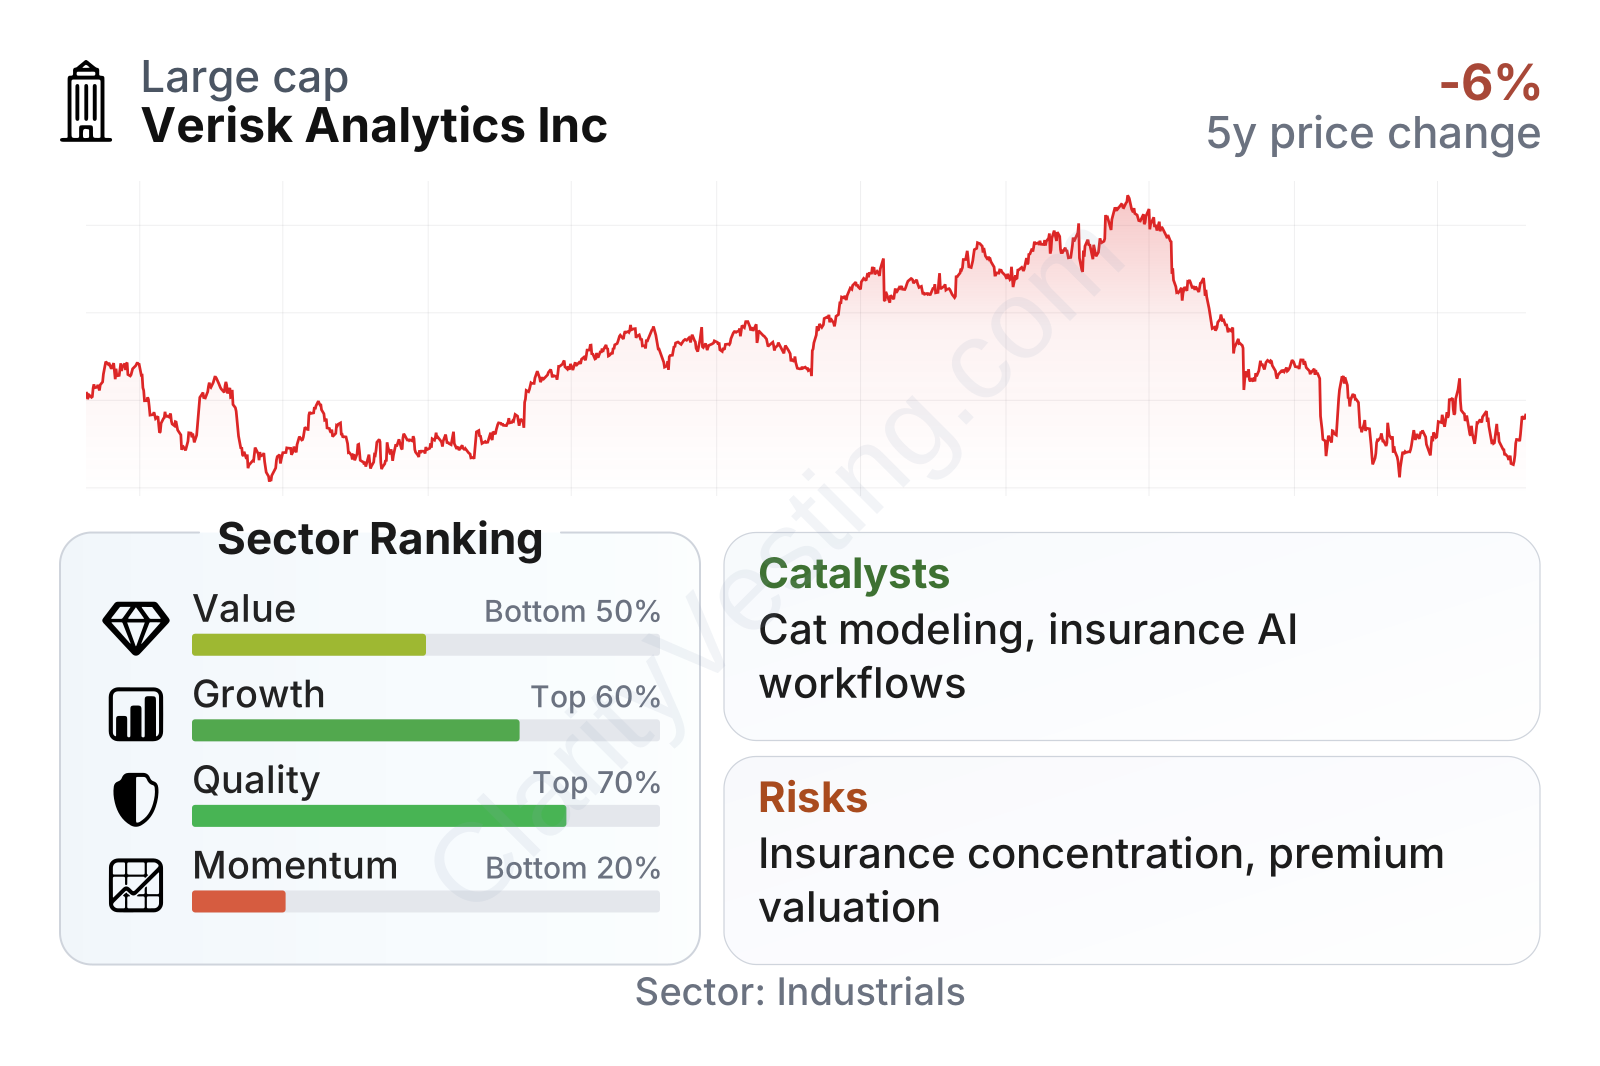
Verisk is a large-cap company with a relatively low beta, which suggests its shares have historically moved less than the broader market. On quality, it stands well above the sector median, helped by very high returns on capital, strong returns on assets, and operating margins above 40%, far better than most peers. Growth is more mixed: recent year-over-year revenue growth is modest compared with the sector median, although the five-year revenue-per-share trend is solid and margins have improved meaningfully over time. On valuation, the stock screens somewhat richer than the sector median on earnings and offers a lower free-cash-flow yield and dividend yield than many peers. Momentum is the weakest area, with the share price materially lagging the broader sector over the last several periods.
Growth
Verisk operates in a sector with durable long-term demand. Insurance is becoming more data-driven, not less, and that trend is reinforced by climate-related losses, rising catastrophe severity, greater regulatory scrutiny, growing use of automation in underwriting and claims, and the need for better fraud detection. All of that increases the value of specialized risk information, event modeling, and workflow software. This is not a flashy market, but it is one where mission-critical tools can compound steadily over time.
The company’s strategy also makes sense for future expansion. Verisk has spent the last few years simplifying its portfolio and focusing on businesses where it has stronger pricing power and better recurring economics. That has made the company more concentrated in its best franchise: insurance analytics. The logic is straightforward. If Verisk can keep deepening its role in underwriting, claims, catastrophe modeling, and data exchange, it can expand revenue without needing explosive customer growth, because existing clients already depend on these tools in everyday operations.
Recent growth has slowed versus stronger periods, with revenue now increasing at a mid-single-digit pace rather than the higher post-repositioning rates seen earlier. Even so, the pattern still points to steady expansion rather than stagnation. For a company with mature market positions and high margins, consistent mid-single-digit organic growth can still support meaningful earnings and cash generation if costs stay disciplined.
Cash generation is an important part of the growth case. Free cash flow has moved higher over the past several years and now sits above $1.1 billion on a trailing basis. That gives Verisk room to keep investing in product development, acquisitions, dividends, and share repurchases. In a business built on information assets and software-like delivery, rising cash flow often matters as much as reported revenue growth.
One of the clearest catalysts is the increasing importance of catastrophe and climate risk modeling. Insurers need more granular tools to price properties exposed to wildfire, flood, convective storm, and other severe weather risks. Verisk’s analytics are already widely used in these areas, and the industry’s need for updated risk assumptions is likely to remain elevated. Another support factor is the broader adoption of automation and AI-enabled workflows in insurance operations, where structured data and proprietary historical loss information are difficult to replicate.
Recent company communications have also emphasized product innovation, analytics enhancements, and continued integration of solutions across underwriting and claims. That is not a one-time event, but it is significant because cross-selling into existing insurance clients tends to be a lower-friction growth path than entering entirely new markets.
Risks
This article is for informational purposes only and does not constitute financial advice. Some content is AI-generated. See Disclaimer